Solar irradiance modelling

A TSI reconstruction back to 1874
MOCASSIM: an extension to ultraviolet spectral irradiance
A spectral irradiance reconstruction back to 1610
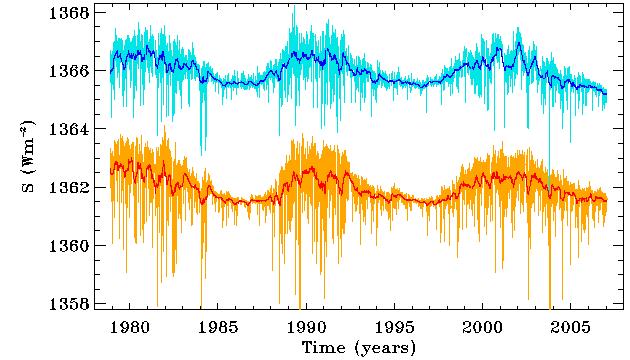
Figure 1: Temporal variation of the total solar irradiance from 1978 to the present. The light blue curve shows daily values, and the thick blue curve a 81-day boxcar running average. The pronounced day-to-day variations in TSI (light blue) are real, rather than the result of measurement uncertainties. This data composite is provided by the PM Observatorium in Davos, Switzerland. The orange and thick red curves are produced by one of our simulation runs, described further below. The curves for the modelled TSI have been shifted downwards by 4 Watt per square meter.Recent observations indicate that the primary driver of TSI changes is the varying photospheric coverage of these different types of solar magnetic structures, although contributions from long-timescale variations associated with a deep-seated physical process, such as cycle-mediated small changes in the efficiency of convective energy transport, cannot be ruled out entirely as yet.
The model involves a number of adjustable parameters, which are determined
by simultaneously fitting the 1978-2007 TSI and spot area time series.
This is a complex multimodal, multi-objective and partly stochastic optimization problem,
which we tackle with the genetic algorithm
PIKAIA. The orange/red curves on Figure
1 is one such best-fitting solution, which indeed is quite similar
to the data, although not in all detail of course given the stochastic
nature of the fragmentation process and of the backside emergences.
Having thus fixed the adjustable parameters in our model
by best-fitting the 1978-2007 time interval, we can use it
to reconstruct the irradiance variations since the beginning
of the Royal Greenwich Observatory sunspot area
dataset, namely 1874. The result of this exercice
is shown on Figure 2 below. As expected for a constant quiet
sun background irradiance, the irradiance variations follow rather
closely the variations in emergence rates, itself closely correlated
to the
variations in the solar cycle amplitude, as measured in sunspot
number.
A genetic algorithm is used to fit the various adjustable parameters
of the model through least-squares fit to UARS/SOLSTICE data
in the 200-400 nm spectral range. By its very design, such a model
cannot be expected to reproduce accurately observed day-to-day spectral
variability, because of its various internal stochastic elements,
most notably the backside emergence and fragmentation algorithms.
However, MOCASSIM reproduces UARS spectral irradiance time series
quite well over timescales larger than a month, as well as the distribution
of spectral irradiance residuals about the mean values, as shown on Figure 3
below
Who in the group works on this:
Paul Charbonneau, Ashley Crouch,
Cassandra Bolduc.
Recent publications by group members on this topic:
TSI reconstruction back to 1874
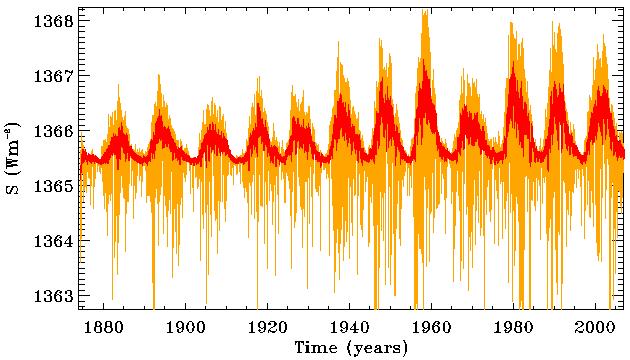
Figure 2:
Temporal variation of the total solar irradiance from
1874 to the present, as reconstructed by our physical model. The
orange curve shows daily values for a single representative
solution, and the thick red curve
mean +/- one sigma for 1000 realization of the best fit model.
This specific reconstruction assumes a temporally
constant quiet-sun irradiance.
MOCASSIM: an extension to ultraviolet spectral irradiance
MOCASSIM
(MOnte CArlo Solar Spectral Irradiance Model)
is a spectrally-resolved four-component version of the TSI model
described above, targeted at the near- and mid-ultraviolet
(150-400nm).
MOCASSIM uses the low-activity ATLAS-3
spectrum to set the quiet sun spectral irradiance, and synthetic
spectra at 5250 and 2750 K
to set the monochromatic contrast ratio of sunspots.
The spectral contribution of faculae is calculated using a simple
black body inversion procedure,
and the network contribution is included as a stochastic emission process.
Reconstructions carry back to
the year 1610 through a Monte Carlo
simulation of sunspots emergence driven by the sunspots number time series.
A modulation of quiet sun emissivity is also introduced, based
the TSI reconstruction of Tapping et al. (2007).
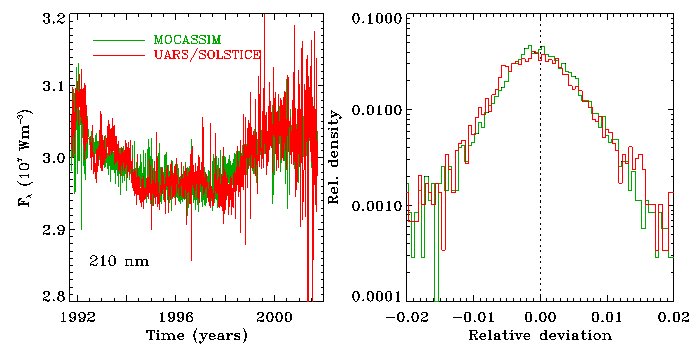
Figure 3:
Left: time series of spectral irradiance at 210 nm, as reconstructed
by MOCASSIM (in green) over the 1992-2001
time interval spanned by UARS/SOLSTICE observations (in red). The
plot on the right shows dthe frequency distribution of photometric
residuals with respect to a 81-day running mean. These plots show that
MOCASSIM properly catches yearly-to-decadal variations, while yielding a good
statistical representation of fluctuations on shorter timescales.
A spectral irradiance reconstruction back to 1610
In its current form, MOCASSIM allows reconstruction of spectra and
spectral irradiance time series across the 150 to 400 nm range,
starting all the way back with the beginning of the sunspot record
in 1610. Figure 4 belows shows two examples at 180 and 370 nm.
Note how, during the 1645-1705 Maunder Minimum, at the shorter wavelength
the emissivity remains significantly above the quiet-sun emissivity
(thin green line), even though few or no sunspots are emerging at
the photosphere. This is due to the contribution of the magnetic network,
which however decreases rapidly with increasing wavelength, and is
insignificant at 370 nm.
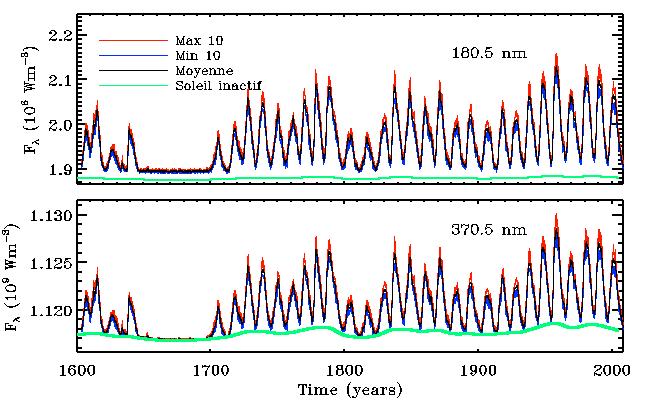
Figure 4:
Two reconstructions of spectral irradiance variations
in the ultraviolet domain, starting in 1610. On each panel,
the green line
is the quiet sun contribution, computed from the TSI reconstruction
of Tapping et al. 2007. The black line is the average of ten reconstructions
using different stochastic realisations of sunspot emergences, and
the red and blue lines indicate the min/max values associated
with this set of ten statistically independent reconstructions.
|
Derničres modifications le 24 octobre 2012 par
paulchar@astro.umontreal.ca.
|
|