Solar cycle modelling

The origin of cycle fluctuations
Solar cycles in 3D MHD simulations of solar convection
The solar cycle modelling work carried out in our research group
focus on dynamo models of the Babcock-Leighton variety. In such models
the regeneration of the poloidal magnetic component takes place in
the surface layers via
the decay of sunspot groups. This is a process well-constrained
observationally. On the one hand, we are seeking to improve
these models, by replacing by numerical simulations
the partly ad hoc source terms that
currently must be introduced in the dynamo equations. On the
other hand, we use the same conventional models to study the various
physical mechanism that can lead to cycle amplitude fluctuations
resembling observations (see Figure 1).
Figure 1: Temporal variation of the number of sunspots observed on the sun's surface. The cycle stands out prominently in this plot, its duration varying from 9 to 14 years with a mean of about 11 years, and its amplitude showing marked cycle-to-cycle variations. The 1645-1715 time period, now known as the Maunder Minimum and during which very few sunspots were observed, does not reflect incomplete data but instead is a real episode of strongly suppressed solar activity. Cycles are numbered acccording to the convention introduced in the 19th century by Rudolf Wolf. The underlying magnetic cycle has twice the period of the cycle for sunspots, the formation of the latter being independent of magnetic polarity.
Some of our recent work has shown that the time delay arising in the regeneration of the poloidal and toroidal magnetic components (see Figure 2A) can produce a host of amplitude modulation effects, including multiperiodicity and chaos (see Figure 2B). In the presence of low-amplitude stochastic "noise", these models can also exhibit intermittency, an irregular alternance of "active" episode, where the cycle's amplitude is normal, and quiescent epochs where the amplitude is strongly suppressed (see Figure 3). Such a behavior can be seen in the sunspot record (a good tracer of the sun's internal magnetic field strength). More specifically, the 1645-1715 episode of strongly reduced activity now known as the Maunder Minimum (see Figure 1) could well be a consequence of intermittency in the solar cycle.
 Figure 2A: A meridian cut of the sun, illustrating the inferred shape of the meridional flow pervading its convective envelope (spanning the outer 30% in radius). This meridional flow is poleward at the surface and equatorward in the vicinity of the core-envelope interface and, in recent incarnations of Babcock-Leighton dynamo models, is the agent transporting the poloidal field produced at the surface by the decay of sunspots [A] towards the base of the convective envelope ([A]-[B]-[C]). The strong rotational shear associated with differential rotation therein induces a toroidal magnetic component, eventually leading to the emergence of new sunspots [C]-[D], heralding the onset of the next cycle. |
 Figure 2B: Bifurcation diagram for a 2D numerical Babcock-Leighton dynamo model. The abcissa measures the strength of the surface source term associated with sunspot decay. Each dot corresponds to the amplitude of a single cycle, for which magnetic energy is here used as a proxy. The transition to chaos via a sequence of period doubling bifurcations is quite obvious here. Multiperiodic windows (some quite narrow), identified by their n-fold periodicity, are interspersed in the chaotic regime. This bifurcation diagram closely resembles those produced by simple one-dimensional iterative maps for the cycle's amplitude. For more detail see the paper by Charbonneau, St-Jean et Zacharias cited below. |
Figure 3: Intermittency in a 2D numerical Babcock-Leighton dynamo model. Part A shows a time series of the toroidal field strength at the core-envelope interface, taken here as a proxy of sunspot number. Part B is a time-latitude diagram constructed at the same depth, showing the equatorward migration of magnetic field belts, their strength coded via the color scale. For more details see the paper by Charbonneau, Blais-Laurier et St-Jean cited below.
Other curious patterns of solar cycle amplitude variations can also be explained naturally in the context of these models. This is the case, for example, of the Gnevyshev-Ohl rule, a marked tendency for a regular alternance of above- and below- average cycle amplitudes (see Figure 4A). Others remain harder to reproduce robustly, such as the Waldmaier rule, a fairly strong anticorrelation between cycle amplitude and rise time (see Figure 4B). Research goes on...
 Figure 4A: The so-called Gnevyshev-Ohl rule, stating that the amplitudes of successive sunspot cycles (dots on the Figure) tend to alternate regularly between values above and below average (blue line). Within Wolf's cycle numbering convention, the amplitude of odd-numbered cycles has been above that of even-numbered cycles from cycle 9 to 21 inclusively. For more detail see the paper by Charbonneau, St-Jean et Beaubien cited below. |
 Figure 4B: The so-called Waldmaier rule, namely an marked anticorrelation between cycle's peak amplitude and rise time, i.e., the time elapsed between the apperance of the first few sunspots of a cycle and the time of peak sunspot number. Numbering of cycles as on Figure 1. This anticorrelation indicates that stronger cycles build up more rapidly, a feature hard to reproduce robustly using extant dynamo models. |
Our three-dimensional magnetohydrodynamical
numerical simulations of solar convection
manage to produce a well-organized large-scale magnetic field, undergoing
regular polarity reversals on timescales of a few decades.
Figure 5A shows an example, in the form of a time-latitude ("butterfly")
diagram constructed at the interface between the convection zone and the
underlying stably-stratified layers.
Part B shows the corresponding time-latitude diagram for the zonally-averaged
radial component of the surface magnertic field. The latter is characterized by
a well-defined dipole moment, aligned with the rotational axis and undergoing
polarity reversals essentially in phase with the deep-seated toroidal component.
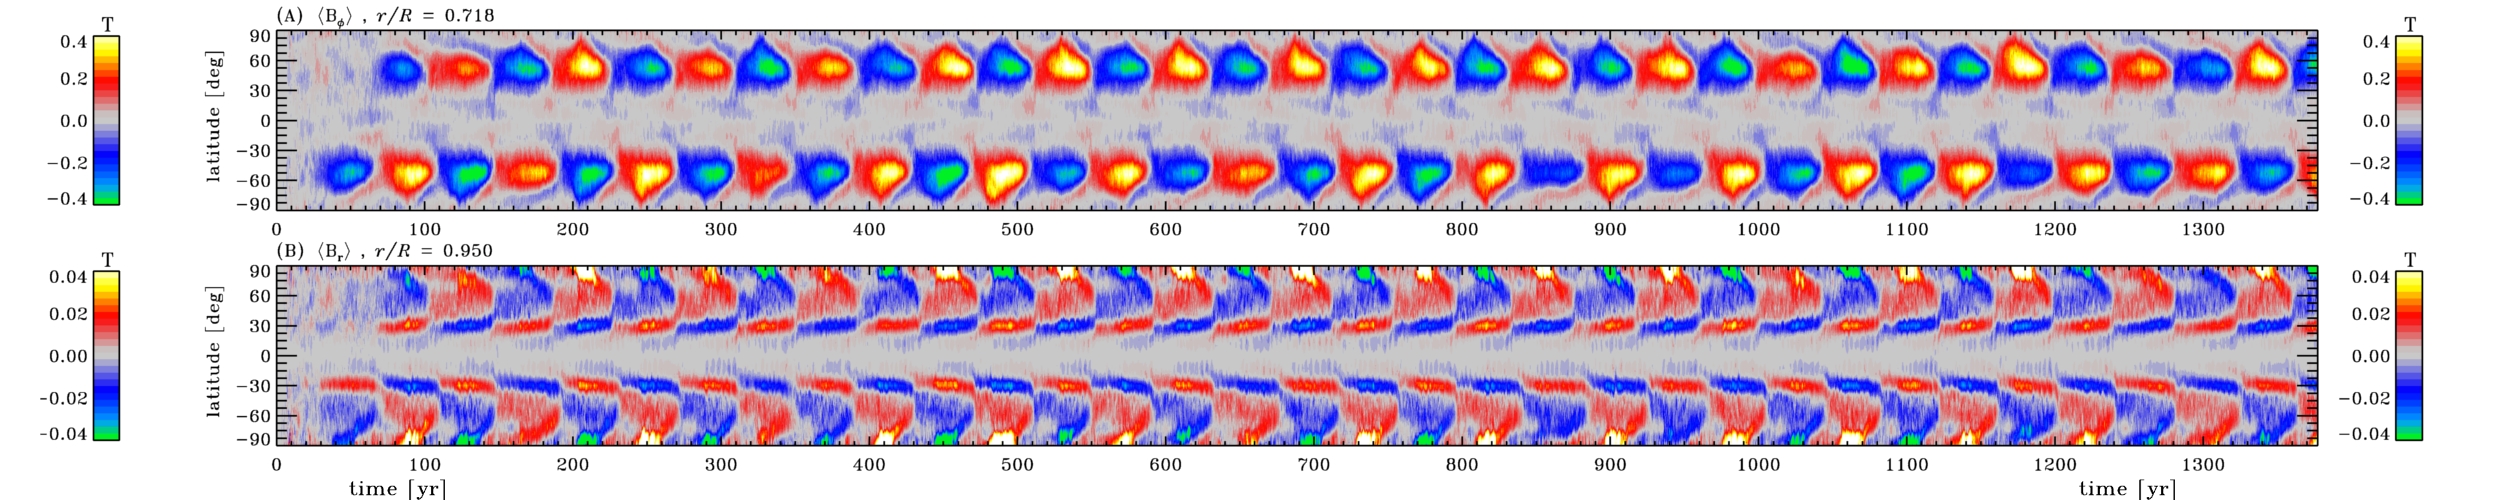
Figure 5: Time-latitude diagrams of the azimutally-averaged (A) toroidal magnetic component at the base of the convective envelope, and (B) surface radial magnetic component, in a 3D MHD simulation of solar convection. The simulation exhibits well-defined magnetic structure, antisymmetric about the equator, and undergoing regular polarity reversals on decadal timescales; all very solar-cycle-like! Simulation by M. Ghizaru.
The magnetic field is antisymmetric about the equator, deep down tends to migrate equatorwards as each cycle unfolds, shows amplitudes fluctuations from one cycle to the next, and a reasonable degree of synchrony between the Northern and Southern solar hemispheres. This was hitherto unseen in strongly turbulent simulations of this type! To be continued!
Who in the group works on this: Paul Charbonneau, Dário Passos, Corinne Simard, Alexandre St-Laurent-Lemerle.
Recent publications by group members on this topic:
|
Last modified 14 April 2010 by
paulchar@astro.umontreal.ca.
|