Avalanche Models of Solar Flares

Development of novel SOC avalanche models
Prediction of solar flare via data assimilation in avalanche models
|
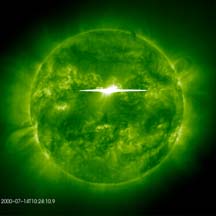
Figure 1: A large solar flare, as seen by SOHO/EIT in the far ultraviolet range of the electromagnetic spectrum. Analysis and modelling of such data has shown that flare release energy over an extraordinary broad range, spanning over 8 orders of magnitude, from a few 1E33 erg for a large flare like this one, down to 1E25 erg at the detection limit of current solar observing instruments. Click on the image for a short close-up movie of this famous "Bastille Day" flare (mpeg, 259KB). |
A significantly problem plaguing many extant SOC models of solar flares is the difficulty in relating the discrete cellular automaton rules on which they are based to the underlying physics of energy release in solar flares, namely magnetic reconnection. Inspired by a physical model put forth some two decades by E.N. Parker as an explanation for coronal heating, we are developing new SOC models where the basic operating element are magnetic fieldlines, instability is based on the angle subtended by two fieldlines coming into close proximity, and avalanches involve topological reconfiguration of fieldline connectivity (akin to classical magnetic reconnection). The system is externally forced by imposing successive small random sideways displacements on randomly selected nodes. Figure 2 shows an example of such a simulation, on a small lattice.
 |
Figure 2: A cellular automaton built from a set of parallel "magnetic field lines" that are allowed to "bend" at a finite number of nodes equally spaced along each such fieldline, and reconfiguring themselves locally when two fieldlines cross at the same node and make an angle exceeding some preset threshold. Click on this image to see an animation of this lattice evolving in response to random deformations of the lines (mpeg 712KB). |
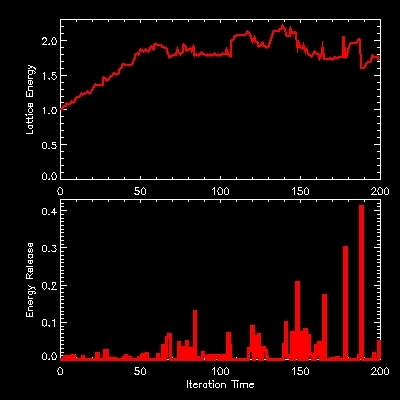
Results obtained to date indicate that such a system does reach a SOC state, where avalanches of reconnection events have a frequency distribution of sizes described by a power law, as with conventional SOC lattice models. Figure 3 shows typical time series of energy stored in the lattice (top panel), and liberated by avalanches (bottom panel).
|
Figure 3: Energy time series in a simulation based on the cellular automaton of Figure 2. The top panel shows the energy stored in the lattice, and the bottom panel the energy liberated by avalanches. Note the temporal intermittency, and the wide range of avalanche sizes produced in the system, two classical features of SOC systems. For more detail see paper by Morales and Charbonneau cited below. |
We are currently investigating the dependence of quantities
predicted by the model, such as the logarithmic slopes of the
frequency distribution of avalanche sizes, on the lattice size,
threshold value, and properties of the forcing. We have also
begun development of a three-dimensional version of the model.
Prediction of solar flare via data assimilation in avalanche models
We are using the 4D-VAR
data assimilation method in a 2D version of the Lu & Hamilton (1991, ApJL
380, L89)
SOC avalanche model, made continuous for the sole purpose of writing
the adjoint equations required by 4D-VAR. Schematically,
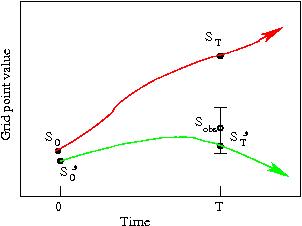
4DVAR operates as shown on Figure 4. A model ---here a simulation
using the avalanche model--- advances a state variable from time 0
to T (red curve), and a comparison to observation is made. Based
on the discrepancy between the prediction and the observation,
by backward integration of the adjoint equations
an adjustment is made to the produce a new initial condition
S', which is again advanced in time to provide an improved
evaluation at time T (green curve). The process is repeated for
as many iteration as needed to bring the forecast within the observation's
error bars. Here, what is being modified is the state of the
2D lattice at time 0, so S corresponds to a single nodal
value on the lattice. The full problem thus requires the
concurrent solution of a large
number (of order 1000) of such optimization problems, one for each
lattice nodel value, using an an error measure the
discrepancy between the time series of flare energy release and that
predicted by the avalanche model between times 0 and T.
The main challenge comes from the fact
that the avalanche has an uncontrollable and unobservable stochastic
component, which serves the dual purpose of loading energy into the
system, and triggering avalanches (for more detail see paper
by Bélanger et al. listed in the bibliography, and references therein).
|
Figure 4: Schematic representation of classical 4D-VAR in action. In the context of flare forecasting using an avalanche model, the state variable S would correspond to a single nodal value on the lattice, and the error measures is defined in terms of quadratic differences between the time series of energy release, rather than the state variable at the end of the assimilation time interval (see text) . |
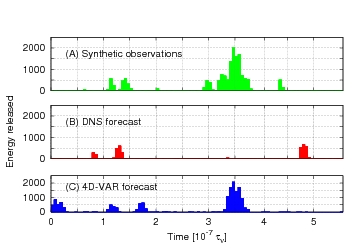
Figure 5 shows results of a ``validation experiment'' that represents an essential first step towards true forecasting. The top panel is a synthetic time series of energy release produced by the avalanche model. The middle panel shows a time series produced by the same model, using the same initial condition but a different realization of random numbers to drive the lattice. These two time series differ markedly. The bottom panel shows the result of using 4DVAR to adjust the initial condition in order to provide the best possible match with the synthetic data. The improvement is striking, and means that we can construct an "optimal" initial condition for a true forecast that is compatible with the prior avalanching behavior of the system. We are currently testing the forecasting performance of initial conditions constructed in this manner. The next step is to carry out the preparation of initial conditions, and subsequent forecast, using real flare data.
|
Figure 5: Validation experiment using 4DVAR and the avalanche model. The top panel is the target time series, the middle panel is a first "forecast" obtained by running the avalanche models, and the bottom panel is the time series produced after a mere 5 iterations of 4DVAR. |
Who in the group works on this: Laura Morales, Éric Bélanger, Paul Charbonneau, Alain Vincent, Richard Joseph.
This work is specifically supported through a Team research Grant from FQRNT
Recent publications by group members on this topic:
|
Derničres modifications le 11 octobre 2007 par
paulchar@astro.umontreal.ca.
|