1223 BC: The oldest eclipse record


Total eclipses of the Sun are arguably the most impressive astronomical
phenomenon that can be observed more or less regularly with the naked eye
(see
slides 9 and
slide 10 of the HAO slide set
The Sun: A Pictorial Introduction). They occur when the Moon reaches a
point in its orbit around the Earth that lies on the line joining the Earth
and Sun. By a remarkable coincidence, the Moon's angular diameter, as seen
from the Earth, is almost identical to that of the Sun. The Sun's disk is then
completely eclipsed, and daytime darkness falls upon the Earth for a few minutes
(This physical explanation of the phenomenon was only put forth much
later, in the first century BC).
Like
comets, solar eclipses were taken to be astrological omens of great
significance. It is therefore
not surprising that such a spectacular event is
often mentioned in surviving written
records and chronicles of ancient civilizations.
The oldest eclipse record is found on a clay tablet uncovered in the ancient city of Ugarit, (in what is now Syria), with two plausible dates usually cited: 3 May 1375 BC or 5 March 1223 BC, the latter being favored by most recents authors on the topic. It is certainly clear that by the eight century BC, the Babylonians were keeping a systematic record of solar eclipses, and may even have been able to predict them fairly accurately based on numerological rules.
References and further reading:
Fotheringham, J.K. 1933, The Story of Hi and Ho, Journal of the British Astronomical Association, 43, 248-257.Zirker, J.B. 1995, Total Eclipses of the Sun, Princeton University Press.
Littman, M., Willcox, F., and Espenak, F. 2000, Totality: Eclipses of the Sun, 2nd ed., Oxford University Press.
ca. 800 BC: The first plausible recorded sunspot observation
Sunspots are concentrations of strong magnetic fields piercing the
solar photosphere. Visually, they
look like dark blemishes on the solar disk (see
slide 1 and
slide 3 of the HAO slide set).
Most sunspots are too small to be readily visible by naked eye observations,
but some reach a size sufficient to be visible without a telescope,
under suitable viewing conditions (for example, when the sun is partially
obscured by fog or thick mist, or clouds). Because of their possible
astrological significances, reports of naked-eye sunspot
observations are indeed to be found in many ancient chronicles and
court chronologies.
The two oldest record of a sunspot observation are found in the Book of Changes, probably the oldest extant Chinese book, compiled in China around or before 800 BC. The text reads "A dou is seen in the Sun", and A mei is seen in the Sun". From the context, the words (i.e., chinese characters) "dou" and "mei" are taken to mean darkening or obscuration.
Astronomers at the court of the Chinese and Korean emperors made regular notes of sunspots, most less elliptical than the one cited above. It seems, however, that observations were not carried out systematically for their own sake, but instead took place whenever astrological prognostication was demanded by the emperor. The surviving sunspots records, though patchy and incomplete, covers nearly 2000 years and represents by far the most extensive pre-telescopic sunspot record.
References and further reading:
Mossman, J.E., 1989, A comprehensive search for sunspots without the aid of a telescope, 1981-1982, in Quarterly J. R. Astr. Soc., 30, 59-73.Stephenson, F.R. 1990, Historical evidence concerning the Sun: interpretation of sunspot records during the telescopic and pre-telescopic eras, in Phil. Trans. R. Soc. London, A330, 499-512.
Hetherington, B. 1996, A chronicle of pre-telescopic astronomy, John Wiley and Sons.
ca. 350 BC: Sun circling under a sheltering sky
One of the major intellectual achievement of ancient Greece is
the physical model of the cosmos developed by
Aristotle (384-322)
An essential feature is the place occupied by the Earth at the center
of the Universe, with the Sun, planets and sphere of fixed stars
revolving about that center, the Sun occupying the fourth
sphere. In this geocentric model the Earth
is absolutely fixed, with the motions of precession and daily rotation
ascribed to the two outermost spheres of the model.
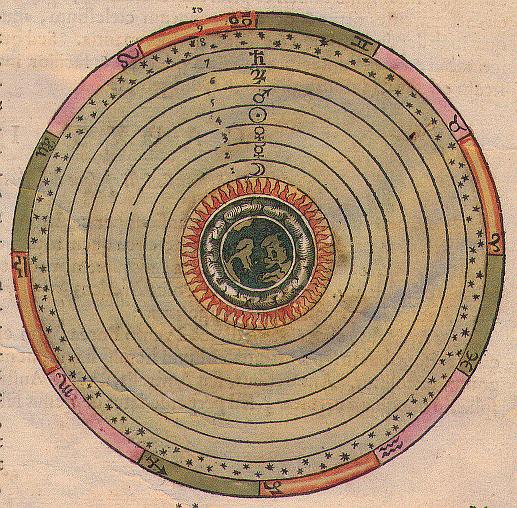
The Aristotelian cosmos. The Earth sits motionless at the center of the universe, and the outer sphere, the Primum Mobile, is assumed to undergo a full revolution in 24 hours.This basic planetary arrangement formed the basis of mathematical model of planetary motion developed four centuries later by Claudius Ptolemy (ca. 100-170). In Aristotle's scheme there exist fundamental physical differences between the terrestrial and celestial realms, as demarcated by the Moon's sphere. Everything under the Moon is made of the four elements earth, water, air and fire, themselves arranged concentrically about the center of the universe. Pure circular motion prevail throughout the heavens, which are are made of an incorruptible fifth element (or "quintessence").
References and further reading:
Grant, E. 1977, Physical Science in the Middle Ages, Cambridge University PressCrowe, M.J. 1990, Theories of the World from Antiquity to the Copernican Revolution, Dover.
Pedersen, O. 1993, Early Physics and Astronomy, revised ed., Cambridge University Press.
ca. 250 BC: The distance to the Sun
The first mathematically-based attempt at determining the Sun-Earth
distance is due to
Aristarchus of Samos
(ca. 310-230 BC).
The procedure followed by Aristarchus is illustrated on the diagram
below; form a triangle
by connecting the Earth (E), Sun (S) and Moon (M). At the first or third Moon
quarter,
the triangle so described in a right-angle triangle (a=90°). The
angle b can be measured by an observer on Earth,
which then allows the angle c to
be computed (c=90-b when a=90°). The ratio
of the Earth-Moon segment (EM) to the Earth-Sun segment (ES) is by definition
equal to sin(c) (in modern trigonometric parlance; Aristarchus expressed
this differently).
![]()
Aristarchus' geometric construction used to estimate the distance to the Sun. The Earth-Sun-Moon triangle and sizes are not drawn to scale.While sound in theory, in practice this procedure is highly inaccurate in the Earth/Sun/Moon case; this is because EM is much smaller than ES, implying that b is very close to 90°, so that c is in turn very small. This has the consequence that a small measurement error on b translates in a large variation in the ratio EM/ES (again in modern parlance, a measurement error db is amplified by a factor 1/(sin c)2, which is large when c is very small). Aristarchus measured b=87°, while the true value is in fact 89° 50 minutes. This may seem a small error, but because of the large error amplification Aristarchus' value leads to EM/ES=19, instead of the true value EM/ES=397. Nonetheless, Aristarchus' calculation was the first to mathematically set the spatial scale of the cosmos.
References and further reading:
Van Helden, A. 1985, Measuring the Universe, University of Chicago Press.Hirschfeld, A.W. 2001, Parallax, Freeman.
While the solar corona is visible at any solar eclipse,
the first explicit mention of what can be pretty ambiguously interpreted
to be the corona was made by the Byzantine historian Leo Diaconus
(ca. 950-994),
as he observed the total eclipse of 22 December 968 from Constantinople
(now Istanbul, Turkey). His observation is preserved in the
Annales Sangallenses, and reads:
"...at the fourth hour of
the day ... darkness covered the earth and all the brightest stars
shone forth. And is was possible to see the disk of the Sun,
dull and unlit, and a dim and feeble glow like a narrow band shining
in a circle around the edge of the disk". Compare this description
to the modern eclipse photographs shown on
slides 9 and
slide 10 of the HAO slide set.
A much older possible description of the corona is said to be found
on engraved oracle bones dating from the Shang dynasty in China
(1766 to 1123 BC), but is far more ambiguous and open to interpretation
than Diaconus' description.
Hetherington, B. 1996, A chronicle of pre-telescopic astronomy,
John Wiley and Sons.
The accompanying text translates to something like:
"...from morning to evening, appeared
something like two black circles within the disk of the Sun,
the one in the upper part being bigger, the other in the lower part
smaller. As shown on the drawing." The facts that the Worcester
monks could apparently distinguish the umbrae and penumbrae of
the sunspots they observed suggests that the spots must have been
truly exceptionally large.
Large sunspots can be visible to the naked-eye under suitable
viewing conditions, for example when the sun is partially obscured
by clouds or mist, particularly at sunrise or sunset. Numerous such
sighting exist in the historical records, starting
with Theophrastus (374-287 B.C.) in the fourth century B.C.
However, by far the most extensive
pre-telescopic records are found in the far east,
especially in
the official records of the Chinese imperial courts,
starting in 165 B.C. In the West,
the dominating views of
Aristotle
concerning the incorruptibility of the heavens
meant that sunspots were "physically impossible", so that sightings
were ignored or ascribed to transit of Mercury or Venus across the
solar disk.
Van Helden, A. 1996, Galileo and Scheiner on sunspots, in
Proc. Am. Phil. Soc., 140, 358-396.
Prominences are large accumulation of (relatively) cold gas held
suspended high in the solar atmosphere by the Sun's magnetic field
(see
Slide 6 and
Slide 7 of the HAO slide set).
Large prominences are often visible at times of solar eclipses, in the
form of small reddish filaments or blobs in the lower corona.
The first fairly unambiguous description of prominences is usually taken
to be that found in the Russian Chronicle of Novgorod, in
the following description of the 1 May 1185 solar eclipse:
"In the evening there as an eclipse of the sun. It was getting very
gloomy and stars were seen ... The sun became similar in appearance to the
moon and from its horns came out somewhat like live embers."
Hetherington, B. 1996, A chronicle of pre-telescopic astronomy,
John Wiley and Sons.
Kuhn, T.S. 1957, The Copernican Revolution, Harvard University Press.
Boas, M. 1962, The Scientific Renaissance 1450-1630, Harper & Row
[Dover reprint available].
Gingerich, O. 1993, The Eye of Heaven,
New York: American Institute of Physics.
Grant, E. 1994, Planets, Stars, & Orbs. The Medieval Cosmos,
1200-1687, Cambridge University Press
Thoren, V.E. 1989, Tycho Brahe, in
The General History of Astronomy, vol. 2A, eds. R. Taton and C. Wilson,
Cambridge University Press, pps. 3-21.
Gingerich, O. 1989, Johannes Kepler, in
The General History of Astronomy, vol. 2A, eds. R. Taton and C. Wilson,
Cambridge University Press, pps. 54-78.
Gingerich, O., and Voelkel, J.R. 1998, Journal for the History
of Astronomy, 29, 1-34.
Physics.
968: The first mention of the solar corona
The solar corona is the hot, extended outer atmosphere of the Sun. It is far
too faint to be seen against the blinding brightness of the solar disk itself,
but becomes visible, and spectacularly so, at times of total solar
eclipses when the solar disk is obscured by the Moon.
![]()
References and further reading:
1128: The first sunspot drawing
This drawing, from the Chronicles of John of Worcester (one of the many
monks who contributed to the Worcester Chronicles), represents
to the best of our knowledge the first surviving sunspot drawing,
from a sighting on Saturday, 8 December 1128. Compare it with
the sunspots seen on
Slide 1 and
Slide 3 of the HAO slide set.
![]()
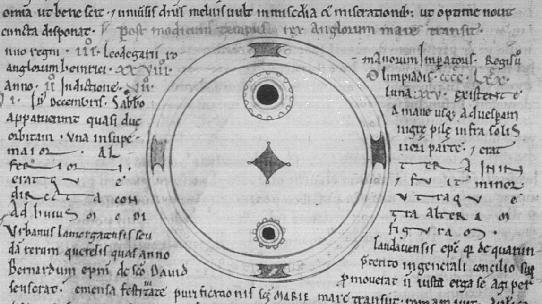
Sunspot drawing in the Chronicles of John of Worcester, twelfth
century. Notice the depiction of the penumbra around each spot.
Reproduced from R.W. Southern, Medieval Humanism,
Harper & Row 1970, [Plate VII].
References and further reading:
1185: The first description of solar prominences
![]()
References and further reading:
Sviatsky, D. 1923, Astronomy in the Russian Chronicles, Journal of the
British Astronomical Association, 33, 285-287.
1543: The Sun moves to center stage
The cosmos of the late Christian medieval era was a fusion of ideas
combining the physics of
Aristotle
and the planetary astronomy of
Ptolemy.
This is the world view that was destroyed in the sixteenth and
seventeenth centuries. The first blow was dealt by
Nicholas Copernicus (1473-1543),
who published his landmark book
De Revolutionibus Orbium Coelestium
in 1543. There Copernicus presented a
new planetary model
with the Sun placed in
center, and letting all planets (including the Earth) orbit
around the Sun. Copernicus also gave the Earth two additional motions:
a daily axial rotation, and a precession of that spin axis. In doing
so, Copernicus eliminated the need for
the two outermost spheres of the ptolemaic model
and produced a system where the speeds of revolution decrease
gradually outward all the way to the fixed stars.
![]()
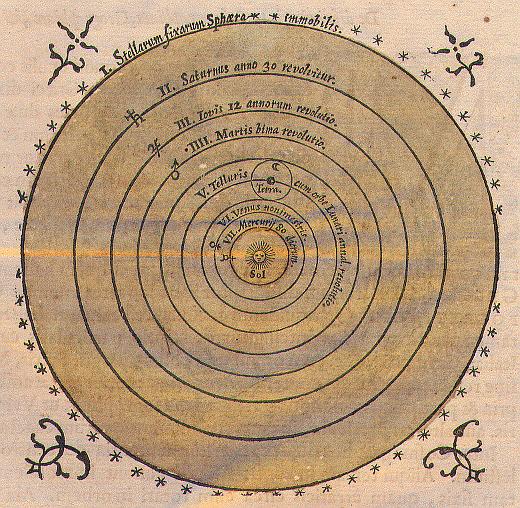
The Copernican planetary model. The Sun is at the center of all
planetary motions, except for the Moon which orbits Earth. Under
this arrangement the orbital speed of planets decreases steadily
outwards, and the outer sphere of fixed stars is truly motionless.
In Copernicus' original model
the Earth has three motions: a daily 24-hr axial rotation, a yearly
orbital motion about the Sun, and a third motion, somewhat
related to precession
which Copernicus thought necessary to properly reproduce ancient
observations.
Copernicus ostensibly introduced his heliocentric model in order
to do away with equants and various motions previously
attributed to the sphere of fixed stars,
but it appears clear that he believed
in the physical reality of his heliocentric hypothesis. Because
Copernicus' model could be construed as yet another mathematical
device useful in astronomy but without physical reality, his model
could at first be used by astronomers without attracting
the ire of philosophers and theologians committed to the centrality
and fixity of the Earth.
This situation was to change in the next century.
References and further reading:
1609: The Sun in focus
An early convert to the Copernican system was
Johannes Kepler (1571-1630).
After ten years of laborious work using the accurate observations
of planetary positions accumulated over 20 years by the astronomer
Tycho Brahe (1546-1601),
Kepler came to realize that the orbital paths of planets has the form
of ellipses with the Sun at one focus, and that the radius vector
joining a given planet to the Sun sweeps equal areas in equal time
(today known as Kepler's first and second laws). In 1609 Kepler published
his landmark
Astronomia Nova,
and in 1619 his
Harmonice mundi,
where what is now known as Kepler's third law (orbital period squared
proportional to mean distance cubed) is first laid out.
Using his planetary model and Brahe's observations, Kepler produced
in 1627 the
Rudolphine Tables
of planetary positions. These proved more accurate, by over an order
of magnitude, than previous tables produced using
the original
planetary model of Copernicus.
![]()
References and further reading:
1610: First telescopic observations of sunspots
In the first decade of the seventeenth century, four
astronomers more or less simultaneously turned the newly invented
telescope toward the Sun, and noted the existence of sunspots.
They were
Johann Goldsmid
(1587-1616, a.k.a. Fabricius)
in Holland,
Thomas Harriot (1560-1621) in England,
Galileo Galilei (1564-1642)
in Italy, and the Jesuit
Christoph Scheiner (1575-1650) in Germany.
![]()
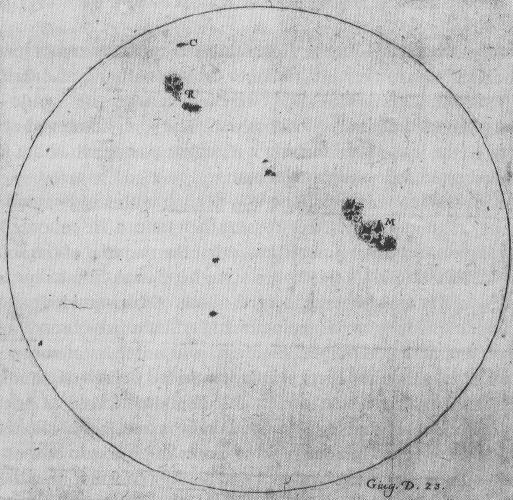
Reproduction of one of Galileo's sunspot drawings. The
umbrae/penumbrae structure is clearly depicted on this
June 23 1612 drawing.
To Harriot
belongs the oldest recorded sunspot
observation, on December 8 1610, as evidenced by
entries in his notebooks,
but he did not pursue these observations
in any systematic or continuous manner at the time.
Fabricius was the first to
publish his results in 1611, and
correctly interpreted the apparent motion of sunspots in
terms of axial rotation of the Sun.
Galileo and
Scheiner,
however, were the most active in using sunspots
to attempt to infer physical properties of the Sun.
To Galileo belongs the credit of making a convincing case that sunspots are
indeed features of the solar surface, as opposed to intra-Mercurial planets
(Scheiner's original position). Galileo's views were first laid out in detail
in his 1613
Letters on Sunspots,
written in response to Scheiner own views on the matter,
first published in 1612 under the pseudonym of Apelles in the form of
three letters to Mark Welser (1558-1614),
Augsburg Magistrate, patron of science, and scientific
correspondent of both Scheiner and Galileo.
The existence of ephemeral blemishes on the Sun's surface was in stark conflict with the then prevailing Ptolemaic/Aristotelian-based cosmology endorsed by the Roman catholic Church (after suitable modification to avoid open contradiction with the Scriptures). Galileo's views on sunspots contributed significantly the sequence of events that landed him in front of the Roman Inquisition in 1633. Officially, Galileo was condemned for disobedience to the Church, in the context of his open endorsement of the Copernican heliocentric planetary model. Growing animosity on the part of the Jesuits who, in particular through their chief astronomer Christopher Clavius (1538-1612), had been originally quite supportive of Galileo's early telescopic discoveries, also contributed to Galileo's downfall.
References and further reading:
Galileo, G. 1613, Letters on Sunspots [in S. Drake (trans.) 1957, Ideas and Opinions of Galileo, Doubleday].
Mitchell, W.M. 1916, The history of the discovery of the solar spots, in Popular Astronomy, 24, 22-ff.
Shea, W.R. 1970, Galileo, Scheiner, and the interpretation of Sunspots, Isis, 61, 498-519.
Drake, S. 1978, Galileo at work: his scientific biography, Chicago: The University of Chicago Press [1995 Dover reprint]
While Galileo rapidly abandonned the systematic observation of sunspots,
to
Christoph Scheiner
they became his lifelong labor. Waffling back and forth
regarding the physical nature of sunspots, he finally settled
on Galileo's interpretation, namely that they were objects of some
sort tied to the solar surface. The accuracy of his observations
led him to a discovery that had eluded even the observationally-talented
Galileo:
the inclination by some 7° of the Sun's rotation axis with
respect to the Earth's orbital axis. Galileo made good use of this
observation as further support to the copernican world system,
going as far as claiming the discovery as his own, naturally triggering
ferocious accusations of plagiarism on the part of Scheiner.
Mitchell, W.M. 1916, The history of the discovery of the solar
spots, in Popular Astronomy, 24, 22-ff.
Shea, W.R. 1970, Galileo, Scheiner, and the interpretation of
Sunspots, Isis, 61, 498-519.
Drake, S. 1978, Galileo at work: his scientific biography,
Chicago: The University of Chicago Press [1995 Dover reprint]
1630: The Sun's rotation axis
![]()
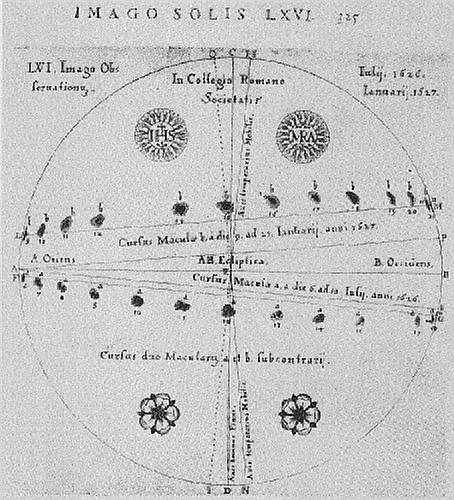
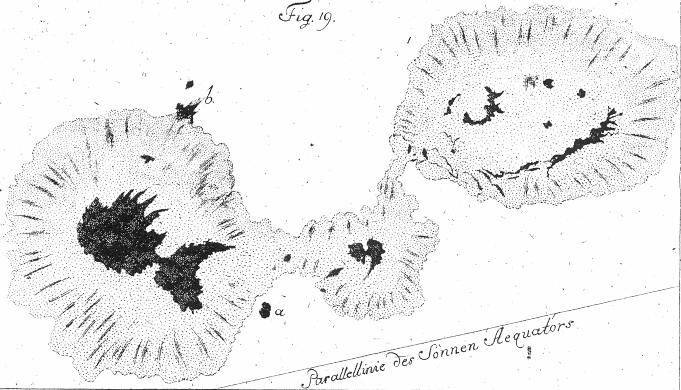
One of the great many sunspot drawings to be found in
Christoph Scheiner's
Rosa Ursina.
By combining on the same drawing observations
made on many successive days, it illustrates the apparent path
traced by two sunspots observed six months apart.
[reproduced from: W.M. Mitchell,
The history of the discovery of the solar spots,
Popular Astronomy, 24 (1916).]
References and further reading:
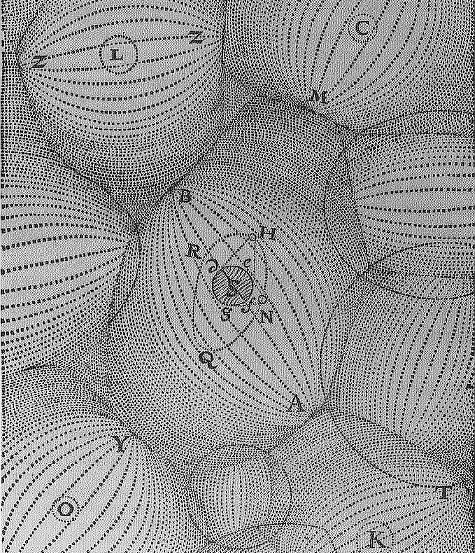
Detail of a diagram from the 1644 Principia philosophiae
of René Descartes,
depicting his conception of the cosmos as an aggregate
of contiguous vortices, most with a star at their center.
S is the Sun.
The
Copernican system
replaced the Earth by the Sun as the center
of the universe, but otherwise maintained a clear distinction
between the Sun, and the "fixed" stars, distributed on the
fixed, outermost sphere of the copernican cosmos. This last concession
to humanity's cosmic centrality
was rejected by the generation of copernicans following
Kepler and
Galileo.
Prominent among them was
René Descartes
(1596-1650) who, in his 1644 book Principia philosophiae,
put forth a
model of the cosmos
where the Sun is but one
of many star, each of which having formed at the center
of a primeaval vortex. Descartes viewed
sunspots as floating aggregates of etheral matter, accreted
along the Sun's rotational axis, where centrifugal forces
are negligible.
References and further reading:
Aiton, E. J. 1989, The Cartesian Vortex Theory, in The General History of Astronomy, vol. 2A, eds. R. Taton and C. Wilson, Cambridge University Press, pps. 207-221.
1645-1715: Sunspots vanish
Sunspots observations continued in the seventeenth century,
with the most active observers being the German
Johannes Hevelius (1611-1687)
and the French Jean Picard (1620-1682). Very few sunspots
were observed from about 1645 to 1715, and when they were
their presence was noted as a noteworthy event
by active astronomers. At that time, a systematic solar observing
program was underway under the direction of
Jean Dominique Cassini
(1625-1712) at the newly founded Observatoire de Paris, with
first Picard and later Philippe La Hire
carrying out the bulk of
the observations.
Historical reconstructions of sunspot
numbers indicate that the dearth of sunspots is real, rather
than the consequence of a lack of diligent observers.
A simultaneous decrease in auroral counts further suggest that
solar activity was greatly reduced during this time period.
![]()
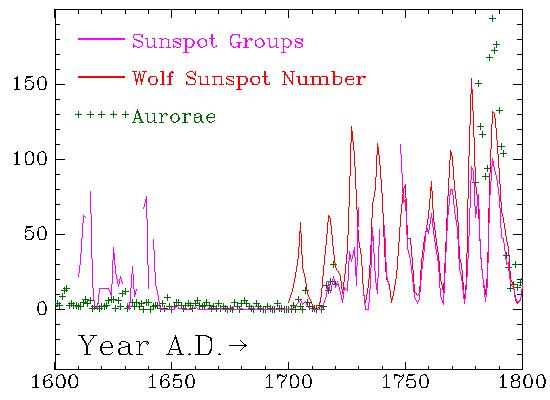
This very anachronistic plot shows the variation in observed sunspot numbers during the time period 1600-1800. The red curve is the Wolf sunspot number, and the purple line a count of sunspot groups based on a reconstruction by D.V. Hoyt. The green crosses are auroral counts, based on a reconstruction by K. Krivsky and J.P. Legrand.
This period is now known as the Maunder minimum, after the solar astronomer E.W. Maunder, who, following the pioneering historical investigations of Gustav Spörer (1822-1895), was most active and steadfast in investigating the dearth of sunspot sightings by astronomers active in the second half of the seventeenth century. The documented occurrence of exceptionally cold winters throughout Europe during those years may be causally related to reduced solar activity, although this remains a topic of controversy.
References and further readings:
Eddy, J.A. 1976, The Maunder Minimum, Science, 192, 1189-1203.Eddy, J.A. 1983, The Maunder minimum: a reappraisal, Solar Phys., 89, 195-207.
Ribes, J. C., and Nesme-Ribes, E. 1993, The solar sunspot cycle in the Maunder minimum AD1645 to AD1715, Astronomy and Astrophysics, 276, 549-563.
Hoyt, D.V. & Schatten, K.H. 1997, The Role of the Sun in Climate Change, Oxford University Press.
1666: The colors of sunlight
Between 1664 and 1666, stimulated by the writings
of
René Descartes
and Robert Boyle (1627-1691),
Isaac Newton (1642-1727)
launched into a series of experiments aimed at
investigating the physical nature of "white light".
In the course
of one of these experiments, Newton let a narrow
beam of sunlight through glass prims, separating
its chromatic component into it's "rainbow" spectrum.
Use of a second inverted prism could then recombine
these colors into the original "white light".
![]()

Sketch made by Newton in his notebook, illustrating his experimental setup used to separate sunlight into its chromatic spectrum. A narrow beam of sunlight enters a dark room through a small hole, traverses a glass prism and its refracted chromatic components projected onto a screen. [Reproduced from: P. Whitfield, Landmarks in Western Science, Routledge, 1999]
Newton explained correctly the production of his artificial rainbow by suggesting that white light is made of a variety of fundamental colors, which are refracted to varying degrees when they cross an interface between two different transparent media, here glass and air. Newton would have never guessed how his curious discovery would, some two centuries later, lead to a true revolution in physics and astronomy.
References and further readings:
Hall, A.R., Isaac Newton, Adventurer in thought, Cambridge University Press reprint, 1996.
1687: The mass of the Sun
The mass of the Sun and its distance from the Earth are
two very fundamental quantities that were only determined
with reasonable accuracy in the eighteenth century. The first
quantitative estimate of the Sun's mass is due to
Isaac Newton (1642-1727).
Newton presented the calculation in his
Principia Mathematica, making
use of his newly
formulated law of universal gravitation. Newton argued that stable
planetary orbits resulted from a balance between centripetal and
gravitational acceleration; In doing so he could finally provide
a physical explanation for the three laws of planetary motions
established empirically by
Kepler. The ratio of Sun-to-Earth mass
can be in principle determined, without knowing the actual value
of the universal gravitational constant. This only required
a knowledge of orbital periods and radii.
Newton, however, used too high a value for the solar parallax,
thus grossly underestimating the Sun-Earth distance, and, consequently,
underestimating the Sun-to-Earth mass ratio by more than a factor of
ten (MEarth/MSun=28700 instead of 332945).
In later editions of his Principia (in 1713 and 1726), Newton used
improved estimates of the solar parallax, and brought his estimate
to within a factor of two of the modern value
![]()
References and further readings:
Wilson, C. 1989, The Newtonian achievement in Astronomy, in The General History of Astronomy, vol. 2A, eds. R. Taton and C. Wilson, Cambridge University Press, pps. 234-274.Hufbauer, K. 1991, Exploring the Sun, The Johns Hopkins University Press.
1774-1801: The Physical nature of sunspots
The physical nature of sunspots remained a topic of controversy
for nearly three centuries. The universally opinionated
Galileo
proposed, with unusual reservation, that sunspots may perhaps be
cloud-like structures in the solar atmosphere.
Scheiner believed them
to be dense objects embedded in the Sun's luminous atmosphere.
In the late eighteenth
century William Herschel
(1738-1822; discoverer of the planet Uranus),
following an hypothesis earlier put forth by A. Wilson in 1774,
suggested that sunspots were opening in the Sun's luminous
atmosphere, allowing a view of the underlying, cooler surface
of the Sun (likely inhabited, in Herschel's then influential
opinion).
![]()
Reproduction of one of Herschel original diagram on the nature of sunspots. This hypothesis relies heavily on the asymmetric appearance of sunspots when seen near the solar limbs, as originally pointed out by A. Wilson in 1774 [from: Phil. Trans. 1801, vol. 91, pp. 265-318 (plate 18)].
References and further readings:
Berry, A. 1898, A Short History of Astronomy (Dover Reprint), chap. 12 Hufbauer, K. 1991, Exploring the Sun, The Johns Hopkins University Press.
1796: The nebular hypothesis and the Sun's origin
By the closing decade of the eighteenth century,
the increasingly powerful reflecting telescopes built by
the German-born English astronomer
William Herschel (1738-1822)
had revealed the existence of a number of diffuse cloud-like structures,
dubbed Nebulae. Inspired by these observations, the
French astronomer and mathematician
Pierre Simon de Laplace (1749-1827)
put forth his nebular hypothesis, according to which
the sun and solar system formed from the gravitational collapse
of an initially slowly rotating, large but diffuse gas cloud.
![]()
Drawing of Nebulae by William Herschell. Herschell believed that these assorted Nebulae could be interpreted as different snapshots of an evolutionary sequence of gravitational collapse into one or more stars, along the lines proposed by Laplace. Reproduced from W. Herschel, Philosophical Transactions of the Royal Society of London 101 (1811), 269-336 (p. 336, Plate IV).
Laplace's cosmological ideas were described in a popular work, published in 1796 and entitled Exposition du systè me du monde. This marked a turning point in the history of science, since therein he categorically rejects the Biblical account of the creation of the Universe, and offers instead a physically-based theory that, in its main thrust if not in all details, remains valid to this day.
References and further readings:
Herschel, W. 1811, Astronomical Observations Relating to the Construction of the Heavens..., Philosophical Transactions of the Royal Society of London 90, 284-292Hoskin, M. (ed.) 1997, The Cambridge Illustrated History of Astronomy, Cambridge University Press, chap. 6
In the 1660's
Isaac Newton
had shown that sunlight can be separated
into separate chromatic components via refraction through a
glass prism. In 1800,
William Herschel
extended Newton's experiment by demonstrating
that invisible "rays" existed beyond the red end of the solar
spectrum. He did so by detecting the temperature rise in
thermometers placed beyond the red end of the visible
solar spectrum.
Herschel boldly conjectured that these invisible caloric rays,
later named infrared radiation, were fundamentally no
different from visible light, and could not be seen simply because
the eye is not sensitive to them. Herschell also sought caloric
rays beyond the violet end of the spectrum, but to no avail.
However, the following year,
Johann Wilhelm Ritter (1776-1810)
used an experimental setup similar to
Herschel's, but placed beyond
the violet end of the spectrum a piece
of paper soaked in silver chloride; the subsequent blackening of
the paper beyond the visible violet demonstrated the existence of
ultraviolet radiation. The following year, and using similar
photochemical means,
William Hyde Wollaston (1766-1828)
independently rediscovered ultraviolet radiation.
Meadows, A.J. 1970, Early Solar Physics, Pergamon Press.
While investigating the refractive properties of
various transparent substances, the English chemist and
physicist
William Hyde Wollaston (1766-1828)
noticed dark lines in the spectrum of the Sun, as viewed through
a glass prism following the method of
Isaac Newton.
Beyond suggesting that these dark lines marked the boundaries
of "natural colors",
Wollaston did not pursue the matter much further. Yet
this marked the first step towards solar spectroscopy, which
was to revolutionalize Solar Physics in the second half of the
century.
Meadows, A.J. 1970, Early Solar Physics, Pergamon Press.
1800: The Sun's invisible radiation
![]()
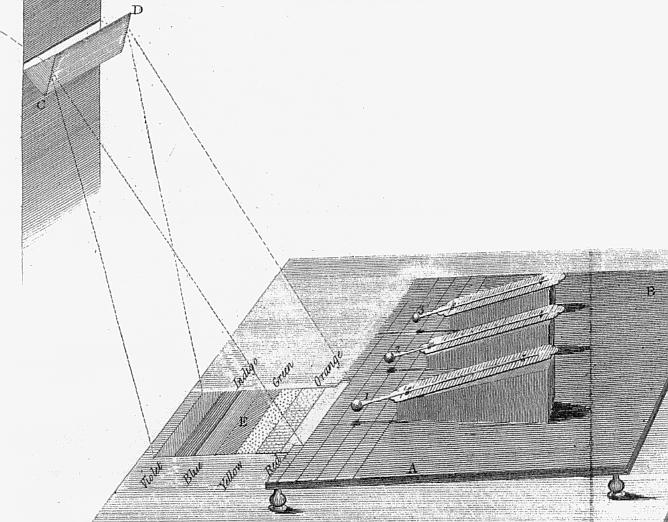
Herschel's experimental setup for the detection of invisible
solar radiation. Sunlight passes through a prism (CD), forming
the usual rainbow spectrum (E). A row of thermometers is positioned
on a table (AB) beyond the red end of the spectrum. Thermometer 1,
aligned with the spectrum,
registers a rise in temperature, while the control thermometers
2 and 3 do not.
References and further readings:
Herschel, W. 1800,
Experiments on the Refrangibility of the Invisible Rays of the Sun,
Philosophical Transactions of the Royal Society of London
90, 284-292
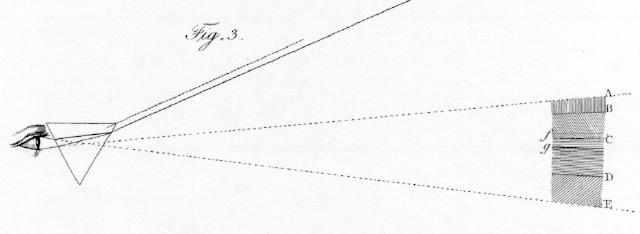
1802: Black lines in sunlight
![]()
References and further readings:
Wollaston, W. H. 1802,
A Method of Examinimg Refractive and Dispersive Powers, by Prismatic Reflection
Philosophical Transactions of the Royal Society of London
92, 365-380
1817: Solar spectroscopy is born
In what was to later lead to some of the more important
advances in solar physics,
Joseph von Fraunhofer
(1787-1826) independently rediscovered the
'dark lines' in the solar spectrum
noticed 15 years earlier by
William Hyde Wollaston (1766-1828).
Fraunhofer pursued the matter mainly because he
saw the possibility of using the lines as wavelength
standards to be used to determine the index of refraction
of optical glasses. Other physicists, however, were quick
to realize that the Fraunhofer lines could be used to infer properties
of the solar atmosphere, as similar lines were being observed in
the laboratory in the spectrum of white light passing through heated gases.
![]()
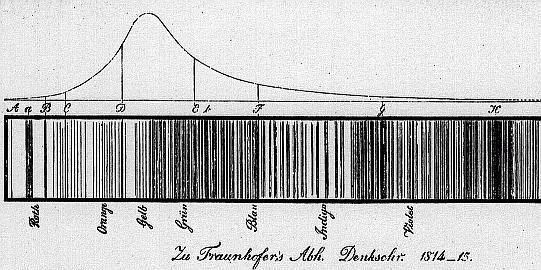
Reproduction of Fraunhofer's original 1817 drawing of the solar
spectrum. The more prominent dark lines are labeled alphabetically;
some of this nomenclature has survived to this day
[from: Denkschriften der K. Acad. der Wissenschaften zu München
1814-15, pp. 193-226]. Compare this to
Wollaston's drawing.
In the hands of David Brewster (1781-1868),
Gustav Kirchhoff (1824-1887),
Robert Wilhelm Bunsen (1811-1899),
and Anders Jonas Ångström (1814-1874),
to name but a few, spectroscopy turned into a true science
which revolutionized not only solar physics, but also astronomy
at large. Still today, most information gathered on the Sun and stars
is obtained through spectroscopic means.
References and further readings:
Meadows, A.J. 1970, Early Solar Physics, Pergamon Press.
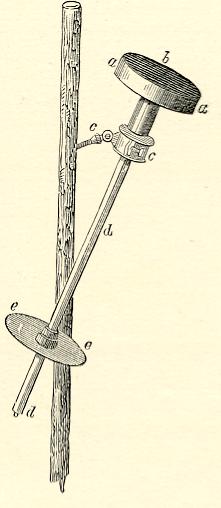 |
Pouillet's pyrheliometer. Water is contained in the cylindrical container a, with the sun-facing side b painted black. The thermometer d is shielded from the Sun by the contained, and the circular plate e is used to align the instrument by ensuring that the container's shadow is entirely projected upon it. [Reproduced from A.C. Young's The Sun (revised edition, 1897). |
Although various scientists had attempted to calculate the Sun's energy output, the first attempts at a direct measurement were carried out independently and more or less simultaneously by the French physicist Claude Pouillet (1790-1868) and British astronomer John Herschel (1792-1871). Although they each designed different apparatus, the underlying principles were the same: a known mass of water is exposed to sunlight for a fixed period of time, and the accompanying rise in temperature recorded with a thermometer. The energy input rate from sunlight is then readily calculated, knowing the heat capacity of water. Their inferred value for the solar constant was about half the accepted modern value of 1367 ± 4 Watt per square meter, because they failed to account for of absorption by the Earth's atmosphere.
References and further readings:
Young, C.A. 1897, The Sun (revised ed.), Appleton and Co., chap. 8Hufbauer, K. 1991, Exploring the Sun, The Johns Hopkins University Press.
1843: The sunspot cycle
Early sunspots observers noted the curious fact that sunspots rarely
appear outside of a latitudinal band of about ± 30°
centered about the solar equator, but otherwise failed to discover
any clear pattern in the appearance and disappearance of sunspots.
In 1826, the German amateur astronomer
Samuel Heinrich Schwabe (1789-1875),
set himself about the task of discovering intra-mercurial planets,
whose existence had been conjectured for centuries. Like many
before him, Schwabe realized that his best chances of detecting
such planets lay with the observation of the apparent shadows
that they would cast upon crossing the visible solar disk during
conjunction; the
primary difficulty with this research program was the ever-present
danger of confusing such planets with small sunspots. Accordingly,
Schwabe began recording very meticulously the position of any sunspot
visible on the solar disk on any day that weather would permit
solar observation. In 1843, after 17 years of observations, Schwabe
had not found a single intra-mercurial planet, but had discovered
something else of great importance: the cyclic increase and decrease
with time of the average number of sunspot visible
on the Sun, with a period that Schwabe originally estimated to be 10 years.
![]()
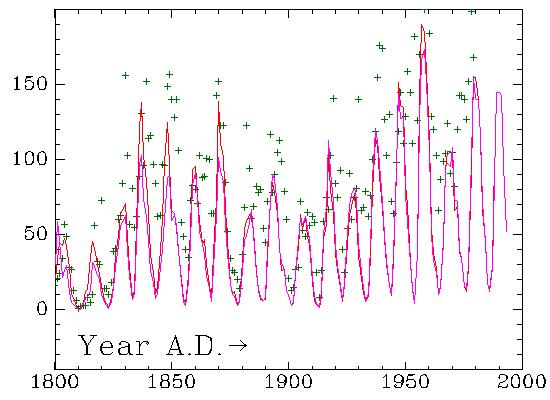
Variation in observed sunspot numbers during the time period 1800-present. The red curve is the Wolf sunspot number, and the purple line a count of sunspot groups based on a reconstruction by D.V. Hoyt. The green crosses are auroral counts, based on a reconstruction by K. Krivsky and J.P. Legrand.
References and further readings:
Stix, M. 1989, The Sun, Springer.
1845: The first solar photograph
The first photographic technique was developed in the 1830's
by J. N. Niepce (1765-1833) and Louis Daguerre (1789-1851),
and relied on the exposure
of a thin iodine layer deposited on a silver substrate, subsequently
fixed in a mercury bath. The images
so produced became known as daguerrotypes.
This imaging technique was
very soon applied to astronomy, through the enthusiastic support
of the French astronomer and politician Francois Arago (1786-1853),
and the British astronomer
John Herschel (1792-1871, son of
William Herschel), who first
coined the term "photography", as well as "positive" and "negative" images.
![]()
The first successful daguerrotype of the Sun, reproduced below,
was made on 2 April 1845 by the French
physicists Louis Fizeau (1819-1896) and Léon Foucault (1819-1868)
(the two being perhaps better known for their
various pioneering measurements of the speed of light). The
exposure was 1/60 of a second. This image shows the umbra/penumbra
structure of sunspots, as well as limb darkening.
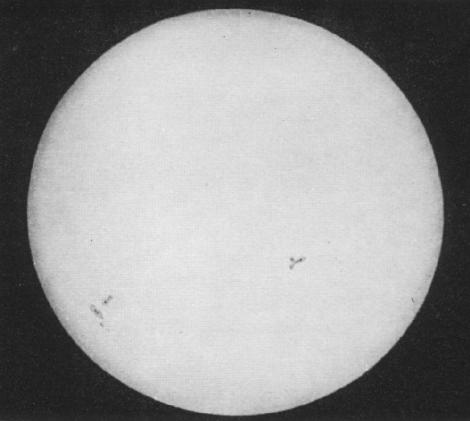
Reproduction of the first daguerrotype of the Sun. The original image was a little over 12 centimeters in diameter. Reproduced from G. De Vaucouleurs, Astronomical Photography, MacMillan, 1961 [plate 1].
Daguerre's photographic process was soon supplanted by a new technique developed starting in 1851, based on a colloidal suspension on a glass substrate, in essence the direct ancestor of modern photographic film. In 1858 daily photographic record of the solar disk using a solar telescope especially designed for photography began at Kew, in England, under the leadership of Warren De la Rue (1815-1889). Photographic techniques were soon thereafter applied to the study of prominences, solar granulation, and solar spectroscopy, with some of the more spectacular results of the period obtained by Jules Janssen (1824-1907) at Meudon, near Paris. The first photograph of a solar prominence was captured by Charles A. Young (1834-1908) in 1870.
The first useful Daguerrotype of a solar eclipse was secured on 28 July 1851 by the photographer/astronomer Berkowski at the Königsberg observatory (then in Prussia, now Kalinigrad in Russia). De la Rue's group also obtained many fine photographs of the 18 July 1860 total eclipse in Spain. Eclipse photographic techniques were further improved by the introduction of radial gradient filters, designed to differentially attenuate the innermost, brightest portion of the corona. The resulting photographs allow to discern details of coronal structure out to many solar radii; see for example slide 9 and slide 10 of the HAO slide set.
References and further readings:
De Vaucouleurs, G. 1961, Astronomical Photography, New York: MacMillan.Lankford, J. 1984, The impact of photography on astronomy, in The General History of Astronomy, vol. 4A, ed. O. Gingerich, Cambridge University Press, pps. 16-39.
As
Schwabe's
discovery of the sunspot cycle gained recognition,
the question immediately arose as to whether the cycle could
be traced farther in the past on the basis of extant sunspot
observations. In this endeavour the most active
researcher was without doubt the Swiss astronomer
Rudolf Wolf
(1816-1893). Faced with the daunting task of
comparing sunspot observations carried out by many different
astronomers using various instruments and observing techniques,
Wolf defined the relative sunspot number (r)
as follows:
where g is the number of sunspots groups visible on the
solar disk, f is the number of individual sunspots (including
those distinguishable within groups), and k is a correction
factor that varies from one observer to the next (with k=1
for Wolf's own observations, by definition). This definition
is still in used today, but r is now usually called
the Wolf (or Zürich) sunspot number. Wolf succeeded in
reliably reconstructing the variations in sunspot number as far
as the The 1755--1766 cycle, which has has since been known
conventionally as
"Cycle 1", with all subsequent cycles numbered consecutively thereafter;
at this writing (January 2000), we are in the rising phase of cycle 23.
Hoyt, D.V. & Schatten, K.H. 1998, Group sunspot numbers:
a new solar activity indicator, Solar Physics, 181, 491-512.
The resolution of this puzzle came in 1858, when
Richard C. Carrington
(1826-1875) in England and shortly thereafter
Gustav Spörer
(1822-1895) in Germany
independently made two key discoveries.
First, the latitude at which sunspots are most often seen decreases
systematically from about 40° to 5° latitude as the sunspot cycle
proceeds from one minimum to the next (see diagram below).
Second, sunspots located
at higher latitudes are carried around the sun more slowly than spots at
lower latitudes. From this, Carrington concluded that
the Sun rotates differentially, yet another argument in favor
of the fluid or gaseous nature of the Sun's outer layers.
The aforementioned historical discrepancies
are then explained by the fact that different astronomers simply observed
the Sun at different epochs of the cycle.
The rapid development of spectroscopic techniques in the second half
of the nineteenth century offered another mean of measuring the
surface differential rotation,
one moreover that is not restricted to latitudes
where sunspots are present:
measurement of the wavelength shift of spectral lines between the approaching
receding solar limb,
as a consequence of the Doppler effect. This was first carried out by
Hermann Vogel
(1841-1907) in 1871, and a few years after by
Charles Young
(1834-1908). These results
were accurate enough
to demonstrate that sunspots rotate at very nearly the same rate
as the sun's photosphere. By the late 1880's
Nils Dúner (1839-1914)
had secured accurate spectroscopic rotational period determinations
at latitudes about twice higher than the sunspot belts, demonstrating
that the Sun's polar regions rotate about 30% more slowly than
its equator.
Interestingly,
Christoph Scheiner had already noted
in his 1630
Rosa Ursina
that the rotation period inferred from tacking sunspots at different
heliocentric latitudes showed a systematic increase with latitude.
However, in Scheiner's Aristotelian framework the Sun could only be
a solid, rigidly rotating sphere, and therefore he interpreted his
data
a proof that sunspots were not markings on the solar surface,
but instead cloud-like structures floating above it, since a fluid Sun
was "physically absurb".
For this reason, most historians of science
continue to attribute the discovery
of solar differential rotation to Carrington and Spörer.
Eddy, J.A., Gilman, P.A., and Trotter, D.E. 1977, Science,
198, 824-829
Both Carrington and Hodgson noted that magnetic monitoring
instruments
registered strong disturbances
at about the same time, but it is not possible to tell
for sure whether these were due to the flare they actually saw.
It is more likely that they were caused by other
generalized solar disturbances of which the flare was but one manifestation.
Following this and other groundbreaking work by
David Brewster (1781-1868) and Ångström,
spectroscopy continued to progress
throughout the second half of the eighteenth century. In the solar
context, some of the most active and innovative observers were
J. Norman Lockyer (1836-1920)
Jules Janssen (1824-1907),
Hermann Carl Vogel (1841-1907),
William Huggins (1824-1910),
Angelo Secchi (1818-1878),
Charles Young
(1834-1908), and
Samuel Langley (1834-1906).
Even at that time,
spectroscopy was still an empirical science without a sound
physical basis, as quantum mechanics lay half a century in the future.
Today coronal mass ejections
are known to represent one of the more energetic
-and geoeffective- manifestation of solar activity, with up
to 10 billion tons of material being ejected into interplanetary
space at speeds reaching up to 1000 kilometer per second. For more
detail on CMEs see
slide 13 and
slide 14
of the HAO slide set).
1848: The sunspot number
![]()
Sunspot drawings by
Johann Hieronymus Schroeter
(1745-1816),
an active solar observer between 1785 and 1795.
Schroeter's sunspot drawings were a primary source for Wolf's
reconstruction of activity cycle number 4 (1785--1798)
References and further readings:
Hoyt, D.V. & Schatten, K.H. 1997, The Role of the Sun in
Climate Change, Oxford University Press.
1852: The sunspot cycle is linked to geomagnetic activity
In 1852,
within a year of the publication of Schwabe's results in Kosmos,
Edward Sabine (1788-1883) announced that the sunspot cycle period was
"absolutely identical" to that of
geomagnetic activity, for which
reliable data had been accumulated since the mid-1830s. In fact
three other
researchers arrived at the same conclusion independently and more or less
simultaneously:
Rudolf Wolf
(1816-1893) and Jean-Alfred Gautier (1793-1881),
both in in Switzerland, and Johann von Lamont
(1805-1879) in Germany.
This marked the beginning of solar-terrestrial
interaction studies.
![]()
The correlation between sunspot number and geomagnetic
activity index. Diagram reproduced from A.C. Young's
The Sun (revised edition, 1897).
References and further readings:
Hoyt, D.V. & Schatten, K.H. 1997, The Role of the Sun in
Climate Change, Oxford University Press.
Kivelson, M.G., and Russell, C.T. (eds.) 1995, Introduction to Space
Physics, Cambridge University Press, chap. 1.
1858-1859: The Sun's differential rotation
Early nineteenth century solar astronomers were increasingly
intrigued at the fact
that determinations of the solar rotation period obtained by tracking
sunspots carried out over the preceding two centuries
varied between anywhere from 25 to 28 days. This difference, while small, was
significantly larger than the accuracy with which good observers
could track sunspot motion.
![]()
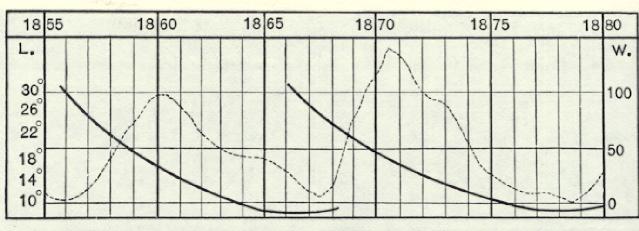
Spörer's Law of sunspot migration.
The thick lines shows the latitude]
at which most sunspots are found
(vertical axis, equator is at zero),
as a function
of time (horizontal axis). The dashed line is the
Wolf sunspot number,
showing the rise and fall of the solar cycle.
References and further readings:
Mitchell, W.M. 1916, The History of the Discovery of Solar Spots,
Popular Astronomy, 24, 22-ff.
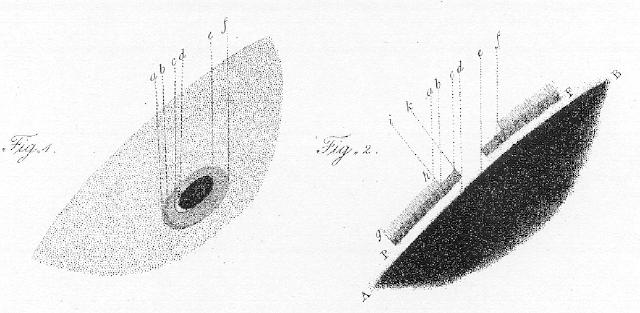
1859: First observation of a solar flare
On 1 September 1859, the amateur astronomer
Richard C. Carrington
(1826-1875) was engaged in his daily monitoring of sunspots, when he
noticed two rapidly brightening patches of light near the middle
of a sunspot group he was studying (indicated by A and B on the drawing
below).
In the following minutes the patches dimmed again while moving with
respect to the active region, finally disappearing at positions C and D.
This unusual event was also independently
observed by R. Hodgson (1804-1872), another British astronomer.
![]()
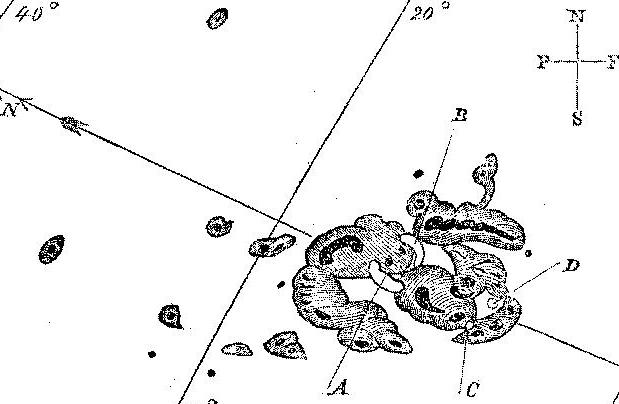
Reproduction of a drawing by R.C. Carrington, showing the location
of the flare he observed while making a drawing
of an active region. Reproduced from his 1860 paper in Monthly
Notices of the Royal Astronomical Society (vol. 20, p. 13).
This serendipitous observation represents the first clear description
of a solar flare, corresponding to a sudden
and intense heating
of solar atmospheric plasma caused by reconnection of
magnetic fields. What Carrington observed would
today be called a two-ribbon flare. Only the largest
flares are bright enough to be seen in visible light.
They are readily seen in X-rays, however (see
slide 15
of the HAO slide set). An earlier, plausible observational report
of a white light flare has been found in the (unpublished) notebooks
of the English scientist and amateur astronomer Stephen Gray (1666-1736),
who on 27 December 1705
observed what he described as a ``flash of lightning'' near a sunspot.
References and further readings:
Carrington, R.C. 1860, Monthly
Notices of the Royal Astronomical Society, 20, p. 13.
Lang, K.R. 2000, The Sun from Space, Springer, chap. 6
1859: The chemical composition of the Sun
In the late 1850s the chemist
Robert Wilhelm Bunsen (1811-1899) and theoretical physicist
Gustav Kirchhoff
(1824-1887), both at Heidelberg,
took on the issue of spectral line identification
pretty much where
Fraunhofer
had left it some 40 years earlier.
By simultaneous observations of the solar spectrum and laboratory
flame spectra, they showed that (bright) emission lines in heated gases
coincide with (dark) absorption lines seen when observing white
light shining through the same cool gas. This established the empirical
basis needed for the
identification of the dark lines seen in the solar spectrum. By careful
comparison with emission lines seen in the laboratory for various
pure gases, Kirchhoff could demonstrate the existence in the Sun of a large
number of chemical elements, mostly metals, also present on Earth.
Hydrogen was identified spectroscopically
in 1862 by A. Ångström (1814-1874), but it is only much later,
in the 1920's,
that Hydrogen was recognized as the most abundant solar constituent.
![]()
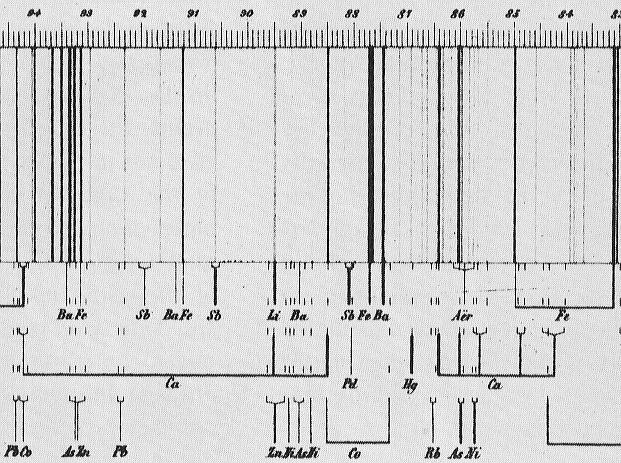
Reproduction of part of the map
of the solar spectrum published in 1863 by
Kirchhoff, showing the identification of a large number of spectral lines
with various chemical elements. Note numerous clear matches for
Iron (Fe).
References and further readings:
Meadows, A.J. 1984, The Origins of Astrophysics, in
The General History of Astronomy, vol. 4A, ed. O. Gingerich,
Cambridge University Press, pps. 3-15.
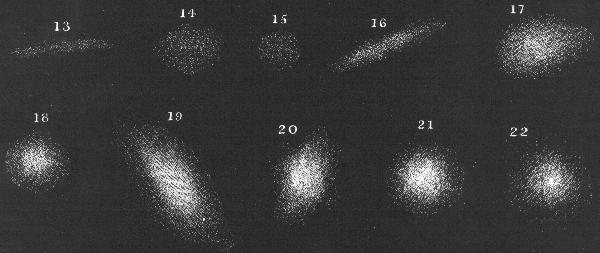
1860: First observations of a coronal mass ejection
The total solar eclipse of 18 July 1860 was probably the most thoroughly
observed eclipse up to that time. The three drawings are a sample
of drawings produced at that time which include depictions
of a peculiar feature in the SW (lower right) portion of the corona.
Based on comparison with modern coronal observations,
it is quite likely that these represent the first record of a
Coronal Mass Ejection in progress.
![]()

Click on the above to view full size diagrams
Drawings of the 1860 eclipse by G. Tempel (top left),
von Feilitzsch (top center),
F.A. Oom (top right), E.W. Murray (bottom left), F. Galton (bottom center),
and C. von Wallenberg (bottom right).
Reproduced from Ranyard, C.A 1879, Mem. Roy. Astron. Soc., 41,
520, chap. 44.
References and further readings:
Eddy, J.A. 1974, A Nineteenth-century Coronal Transient, in
Astronomy and Astrophysics, 34, 235-240.
1865: The first solar cycle model
For nearly two decades the sunspot cycle uncovered by
Schwabe begged for an explanation.
In the quest for a physical explanation, its
Its apparent cyclicity lead naturally to a well-known piece
of celestial clockwork: planetary motions.
Already in 1852,
Rudolf Wolf took due note of the approximate
numerical coincidence between the sunspot cycle period of 11.1 years
with the orbital period of Jupiter (11.86 yr), and later proceeded to
fit his time series of
relative sunspot number
to a quadruple-harmonic function based on the orbital periods
of Jupiter, Saturn, Earth and Venus. However, Wolf himself
was not overly impressed with his fits, and he wisely refrained from
drawing strong conclusions from his results. However, others would soon
discover what looked for a while like a very appealing variation on this theme,
based on planetary tidal influences.
![]()
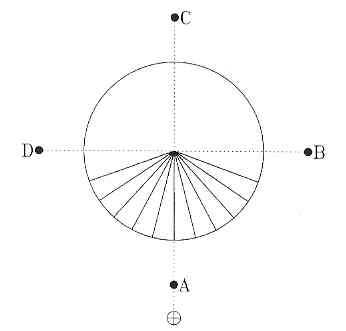 |
The method used by the Kew team to link the variations of sunspot areas with planetary positions. The diagram is drawn in the solar equatorial plane. The portion of the solar disk facing Earth (bottom) is divided into 10 contiguous longitudinal sectors each 14 deg wide. As solar rotation carries sunspots across the sectors, the total sunspot areas in each sector are computed and grouped according to this or that planet being in the quadrant centered on conjunction (A), opposition (C) and quadrature (B and D). [Reproduced from: P. Charbonneau, Journal for the history of astronomy, 33, Fig. 4] |
The first detailed, quantitative physical model of the solar cycle was developped between 1865 and 1872 by an odd trio of solar observers working at Kew Observatory in England: the terrestrial magnetism expert and observatory's director Balfour Stewart (1828-1887); The head of the solar photographic program and oftentimes financial backer Warren De La Rue (1815-1889); and the human computer Benjamin Loewy, a young astronomer trained in Hamburg and hired specifically for data reduction work on the various solar projects ongoing at Kew. Following up on an earlier idea by Stewart, they looked for correlations between planetary ecliptical longitudes and the appearance, growth and decay of individual spots located at specific heliographic longitudes. While they originally found a number of promising correlations involving Venus, Jupiter and Mercury, these all fail to hold as more extended data became available. By 1874 they had largely abandoned the idea, although for half century theirs remained the only extant physical model of the solar cycle, and as such was often discussed in solar physics textbooks into the first decades of the twentieth century. times.
References and further readings:
Charbonneau, P., The rise and fall of the first solar cycle model, in Journal for the history of astronomy, 33, 351-372, 2002.
De La Rue, W., Stewart, B., and Loewy, B., Researches on solar physics. Second series. On the behavoir of the sun-spots with regard to increase and diminution, Proceedings of the Royal Society of London, 14, 59-63, 1865.
1868: The discovery of Helium
Because of the extreme brightness of the solar disks, observation of the Sun's
outer atmosphere and corona was only possible during total solar eclipses.
Their short duration made such observations very difficult, and at the mercy
of clouds and inclement weather. However, in 1868 both
J. Norman Lockyer and
Jules Janssen
hit on the same idea: to use a spectroscope to observe the sun over a very
restricted range of wavelength in the red, where the contrast of atmospheric
structures such as prominences is strong. In this manner Lockyer and Janssen
could observe prominences in broad daylight, and (among other discoveries),
could finally bury once and for all
the idea that prominences where features of the Moon's atmosphere.
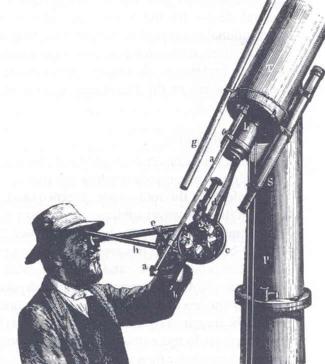 |
J. Norman Lockyer observing solar prominences through a spectrograph replacin g the eyepiece of his telescope. Note the seven prisms mounted on the wheel c, needed to produce the very high spectral dispersion required. [Reproduced from: K. Hufbauer's Exploring the Sun (Johns Hopkins, 1991; F ig. 2.8). |
Nonetheless, it is still during a total solar eclipse that took place what, retrospectively, was certainly one of the greatest discovery of nineteenth century solar physics. This time working together, Lockyer and Janssen (among others) observed in a prominence spectrum an emission line in the yellow portion of the spectrum, which did not correspond to any line of any known chemical element. Janssen and Lockyer pursued their observations the following days using their new observing method, which led Lockyer to bodly suggest that this line was due to an element hitherto unknown on Earth, and which he named Helium (from Helios, the sun god of ancient greek mythology). It is only in 1895 that Helium was isolated in the laboratory by William Ramsay (1852-1916).
The possibility to observe the solar outer atmospheric layers at any time led to a dramatic quickening in observational studies of the solar atmosphere. This was deemed such an important instrumental breakthrough that the Académie des Sciences de Paris issued a commemorative medal bearing the images of both Lockyer and Janssen.
References and further readings:
Meadows, A.J. 1970, Early Solar Physics, Pergamon Press.
1869: The coronal green line
At the 7 August 1969 solar eclipse, visible in North America,
the american astronomers
Charles A. Young (1834-1908)
and William Harkness (1837-1903)
both independently noted the presence of a faint
emission line in the green part of the otherwise
featureless coronal spectrum.
![]()
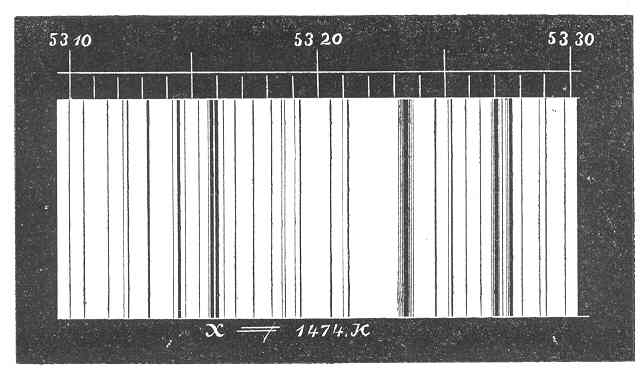
Late nineteenth century Map of the coronal spectrum in the vicinity of the so-called "green line" ascribed to the mysterious chemical element "coronium". The numerical scale on top corresponds to the modern scale introduced by Angstrom, while the "1474" label refers to a scale introduced earlier by Kirchhoff. These are all emission lines superimposed on a fainter continuum. [Reproduced from: A.C. Young, The Sun, second edition 1896, Fig. 93 (p. 258)]
Young, one of the leading spectroscopists of his times, would have never imagined that this discovery would offer solar astronomers a puzzle that would survive him by over three decades. Young himself put a lot effort in identifying the mysterious "coronal green line", first tentastively identifying it with a laboratory iron line, then in 1876 resolving iit into a doublet of which one component did not coincide with anything known in the laboratory. Young and others thus suggested the possible existence of a new chemical element unknown on Earth, which they named coronium.
References and further readings:
Meadows, A.J. 1970, Early Solar Physics, Pergamon Press.
More on Coronium, from laserstars.org
Knowing the Sun's mass and radius, Lane could integrate the
density profile to set the density scale, leading to a surface density
of 0.000363 gram per cubic centimeters.
Then, using then the perfect gas
law, he could estimate the sun's atmospheric temperature,
arriving at at 30,000K. Though some five times too high by modern
standards, this confirmed the high temperatures inferred
by spectroscopic means.
Powell, C.S., J. Homer Lane and the internal structure of the sun,
in Journal for the history of astronomy, 19(3),
183-199, 1988.
Tassoul, J.-L., and Tassoul, M., A concise history of solar
and stellar physics, Princeton University
Press, 2004.
1870: The internal structure of the sun
Throughout the eighteenth and nineteenth century, ideas regarding
the internal constitution of the sun and stars ranged high
and wide. By the 1860's, the spectroscopic work of Kirchoff
and collaborators had offered strong evidence that
at least the solar atmosphere was in gaseous form, and quite
hot at that, but ideas regarding the solar interior remained
in the realm of pure speculation. This first began to change
with the groundbreaking work Jonathan H. Lane (1819-1880),
who in 1870 published a paper in the
American Journal of Science and Arts
(vol. 50, p. 57) presenting a first mathematical
model of the solar interior. Lane assumed that the sun's interior
was gaseous and chemically homogeneous
throughout, and in a state of hydrostatic equilibrium,
whereby the inward gravitational pull of the sun's mass is everywhere balanced
by an outward gradient in gas pressure. Further assuming that
thermal equilibrium enforced by convective motions would
lead to an adiabatic stratification,
Lane obtained mathematical relationships
describing the rise of density
and temperature as one moves from the surface towards the sun's
center.
![]()
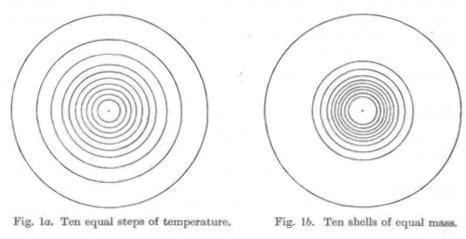
Diagrams illustrating
the internal structure of Lane's polytropic spheres. The two sets
of concentrics spherical shells drawn here correspond
to ten equally spaced isolevels of temperature (left)
and fractional mass
(right), and illustrate graphically the internal
stratification of stars in simultaneous hydrostatic and
convective equilibrium.
[Reproduced from
A.S. Eddington, The internal constitution of the stars, 1926
(1959 Dover reprint), Fig. 1]
References and further readings:
1881: The solar constant, again
By the second half of the nineteenth century, after various
solar observing expedition to mountaintops,
it was becoming
increasingly clear that the Earth's atmosphere absorbs a significant
portion of the sun's luminosity. Consequently, attempts at determining
the solar constant were moved to the highest practical altitudes.
![]()
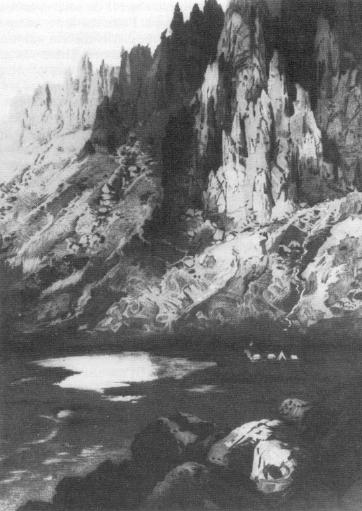 |
Langley's base camp on California's Mt Whitney, July 1881. Some of Langley's instruments failed to arrive or arrived damaged, with the crucial spectral bolometer back in working order only by the end of August. The expedition was cut short on 8 September due to worsening observing conditions caused by the breakout of a series of wildfires elsewhere in California a few days earlier. Nonetheless, valuable data were collected. Reproduced from: Eddy, J.A. 1990, J. Hist. Astron., 21, p. 115. |
The American scientist Samuel Langley (1834-1906) carried out the most elaborate attempt at determining the solar constant at the time, during an expedition to Mt Whitney, California, in July 1881. Using his recently invented bolometer (an instrument based on the varying electrical resistivity of metals with temperature), as well as other instruments, Langley carried out measurements at different wavelengths and at different altitudes, demonstrating the strong variation with wavelength of the absorption by Earth's atmosphere. However, the solar constant value he calculated at the time, 2903 Watt per square meters, is nearly a factor of two larger than the modern value (1367 W/m2), something apparently due to errors in the data reduction procedure, since Langley's later assistant Charles Abbot (1872-1973) obtained 1465 W/m2 with the original Mt Whitney data.
References and further readings:
Hufbauer, K. 1991, Exploring the Sun, The Johns Hopkins University Press.Eddy, J.A. 1990, Journal for the History of Astronomy, 21, p. 115.
Foukal, P.V. 1990, Solar Astrophysics, John Wiley and Sons.
1899: The Sun and the Aurora Borealis
The idea of solar-terrestrial interactions, going back to
William Herschel's
suggestion of a correlation
between sunspots and climate, was buttressed somewhat by the
1852 discovery of the
link between geomagnetic activity and the sunspot cycle,
but throughout the nineteenth the overall idea was
considered suspicious by the scientific establishment. The modern era
of solar-terrestrial interaction studies was launched by the
pioneer norwegian scientist
Kristian Birkeland (1867-1917) who, in the course of the 1899-1900
Norwegian Polar Expedition,
set out to study in detail the Aurorae Borealis. Birkeland
concluded from his various observations that aurorae are
caused by the episodic
arrival of beams of charged particles from the Sun, deflected and guided
to high geographic latitudes by the Earth's magnetic field.
![]()
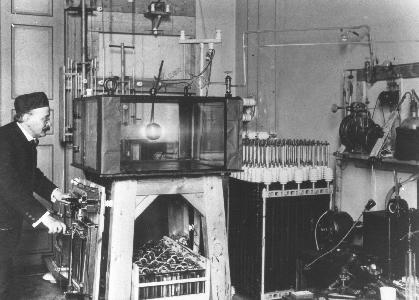
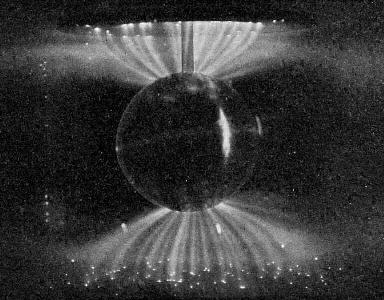
The photograph on the left shows Birkeland's so-called terella experiment (with Birkeland himself operating the apparatus). Beams of electrons are shot at a spherical magnet to produce light emission concentrated in auroral-like arcs (photograph on right). [Images downloaded from Birkeland current document on www.answers.com]
In the first decade of the twentieth century Birkeland went on to produce artificial aurorae in his laboratory, by sending cathode rays (beams of electrons) on a spherical magnet, as depicted on the above photographs. By modern standards, Birkeland explanation of the origin of aurora borealis is correct in the main although not in all details. Unfortunately, Birkeland's groundbreaking contribution to auroral physics were dismissed by most other researchers at the time as overly speculative or even irrelevant, and only gained proper appreciation in the second half of the twentieth century.
References and further reading:
Project NORDLYS - Northern Lights - Birkeland
Jago, L., The Northern Lights, Penguin Press, 2002 Kivelson, M.G., and Russell, C.T. (eds.) 1995, Introduction to Space Physics, Cambridge University Press, chap. 1.
1904: The butterfly diagram
![]()
Photograph of the first sunspot butterfly diagram, originally drawn in
1904 and extended up to 1913
by Walter and Annie Maunder. Over each successive solar rotation,
a vertical line segment spanning the range of latitudes where sunspots are obse
rved
is drawn on a time-latitude diagram.
This results in a striking visual depiction of the wave-like
spatiotemporal progression of magnetic activity in the course of the
solar cycle.
[Source: T.J. Bogdan/High Altitude Observatory]
While the equatorward drift of sunspot emergences as the cycle proceeds had
been noted already in the mid-nineteenth century by
Spörer and
Carrington, it was put on his most
graphicaly striking form by the husband-and-wife team
of
E. Walter Maunder(1851-1928)
and
Annie Maunder(1868-1947).
It occurred to them to plot, on a time-latitude diagram, the latitude
at which sunspots are observed, independently of their heliographic longitude,
over a time span covering a complete solar cycle. This graphical
depiction remains in use today, although what is commonly
plotted is the fractional area coverage of sunspots as a function
of latitude (see for example
this butterfly diagram, produced by D. Hathaway
at NASA's Marshall Space Flight Center).
The sequential "butterflies"
defined by successive cycles are tracking the
equatorward progression of a cyclic "magnetic wave" produced
deep within the solar interior by a hydromagnetic dynamo mechanism.
References and further reading:
Century-old sunspot chart is restored, UCAR Quarterly Communication, summer 2000.
Maunder, E.W., Month. Not. Roy. Astr. Soc., 64, 747 (1904)
1906: The structure of the solar atmosphere
Since Kirchhoff, it was generally believed that the solar
atmosphere was made of a layer of cool gas, illuminated
from below by the hotter, luminous solar interior. Such
an inert atmosphere would appear darker near the solar limbs
than at disk center, since in the former situation a greater
thickness of atmosphere is traversed along the line-of-sight.
This limb darkening had indeed been observed since Galileo's time,
but the accurate quantitative measurements made in the second
half of the nineteenth century, in particular by
Langley, yielded results incompatible
with a simple inert, absorbing atmosphere.
![]()
![]()
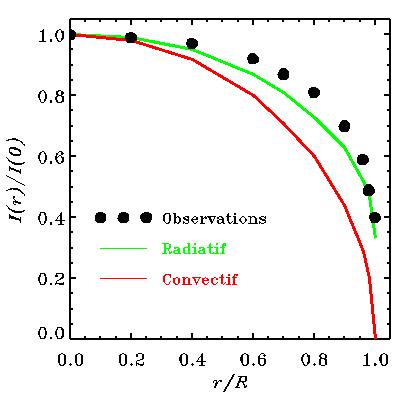 |
Modern plot of the numerical results tabulated in the landmark 1906 paper by Schwarzschild cited below. The plots shows the expected center-to-limb darkening, the green line corresponding to an atmosphere in radiative equalibrium, and the red line to the adiabatic stratification expected from convective equilibrium. The solid dots are the measured values. Disk center is at r/R=0 and the limb at r/R=1. |
Progress first took place at the hand of the german-born british physicist Arthur Schuster (1851-1934), who in a series of papers written between 1903 and 1905 investigated the passage of radiation through an atmosphere that can not only absorp, but also emit and scatter and re-emit the light traversing it. A full model of the solar atmosphere based on radiative equilibrium was soon put calculated by the german astrophysicist Karl Schwarzschild (1873-1916), who could also show that the observed limb solar darkening profile pointed to a state of radiative equilibrium, rather than the adiabatic stratification expected to result from convective equilibrium. Schwarzschild's remarkable 1906 paper opened the door to the physical interpretation of stellar spectra, and more generally to the construction of realistic structural and evolutionary models of the sun and stars.
References and further reading:
Meadows, A.J. 1970, Early Solar Physics, Pergamon Press.
Tassoul, J.-L., and Tassoul, M., A concise history of solar and stellar physics, Princeton University Press, 2004.
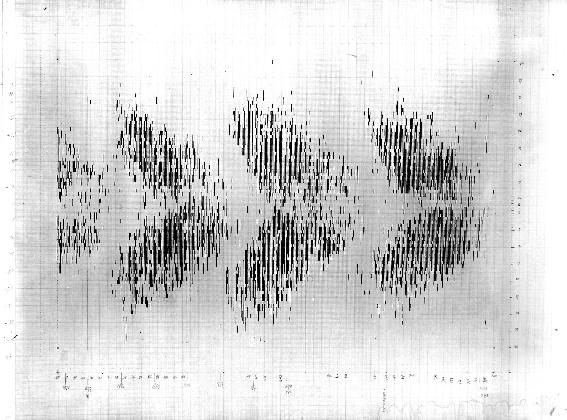
1908: The magnetic nature of sunspots
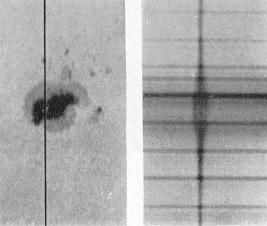 |
The magnetically-induced Zeeman splitting in the spectrum of a sunspot. Reproduced from the 1919 paper by G.E. Hale, F. Ellerman, S.B. Nicholson, and A.H. Joy (in The Astrophysical Journal, vol. 49, pps. 153-178). |
The study of sunspots and their 11-year cycle was finally put on a firm physical footing by the epoch-making work of George Ellery Hale (1868-1938) and collaborators, in the opening decades of the twentieth century. In 1907-1908, by measuring the Zeeman splitting in magnetically sensitive lines in the spectra of sunspots and detecting the polarization of the split spectral components, Hale provided the first unambiguous and quantitative demonstration that sunspots are the seats of strong magnetic fields (see also slide 4 and slide 5 of the HAO slide set The Sun: a Pictorial Introduction). Not only was this the first detection of a magnetic field outside the Earth, but the inferred magnetic field strength, 3000 Gauss, turned out over a thousand times greater than the Earth's own magnetic field. It was subsequently realized that the pressure provided by such strong magnetic field would also lead naturally to the lower temperatures observed within the sunspots, as compared to the photosphere.
References and further readings:
Hale, G.E. 1908, On the probable existence of a magnetic field in sunspots, The Astrophysical Journal, 28, pps. 315-343,
Stix, M. 1989, The Sun, Springer.
1919: The Sun's magnetic cycle
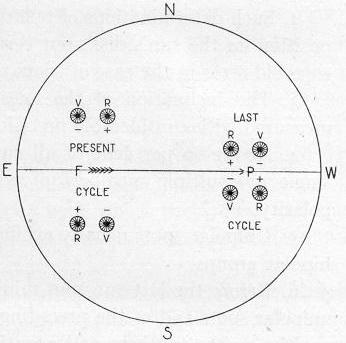 |
A diagram taken from the 1919 paper by G.E. Hale, F. Ellerman, S.B. Nicholson, and A.H. Joy (in The Astrophysical Journal, vol. 49, pps. 153-178), illustrating what is now known as Hale's polarity laws.. This presented solid evidence for the existence of a well-organized large-scale magnetic field in the solar interior, which cyclically changes polarity approximately every 11 years. |
In the decade following his groundbreaking discovery of sunspot magnetic fields, George Ellery Hale (1868-1938) and his collaborators went on to show that large sunspots pairs almost always (1) show the same magnetic polarity pattern in each solar hemisphere, (2) show opposite polarity patterns between the North and South solar hemispheres, and (3) these polarity patterns are reversed from one sunspot cycle to the next, indicating that the physical magnetic cycle has a period of twice the sunspot cycle period. These empirical observations have stood the test of time and are since known as Hale's polarity Laws. Their physical origin is now now known to originate with the operation of a large scale hydromagnetic dynamo within the solar interior, although the details of the process are far from adequately understood. Because the sun's dynamo generated magnetic field is ultimately responsible for all manifestations of solar activity (flares, coronal mass ejections, etc.), to this day solar dynamo modeling remains a very active area of research in solar physics.
References and further readings:
Hale, G.E., Ellerman, F., Nicholson, S.B., and Joy, A.H. 1919, The Astrophysical Journal, 49, pps. 153-178,
Stix, M. 1989, The Sun, Springer.
1926: The internal structure of the sun, again
The theory of
solar internal structure originally
developped by Lane
in 1870, and later elaborated upon by many researchers
including most notably August Ritter (1826-1908)
and Robert Emden (1862-1940), reached its mature form in the
all-encompassing theory of stellar structure
developped by
Arthur Stanley Eddington (1882-1944)
over a ten year period starting
in 1916, and culminating with the publication in 1926 of his
book The Internal Constitution of the Stars.
![]()
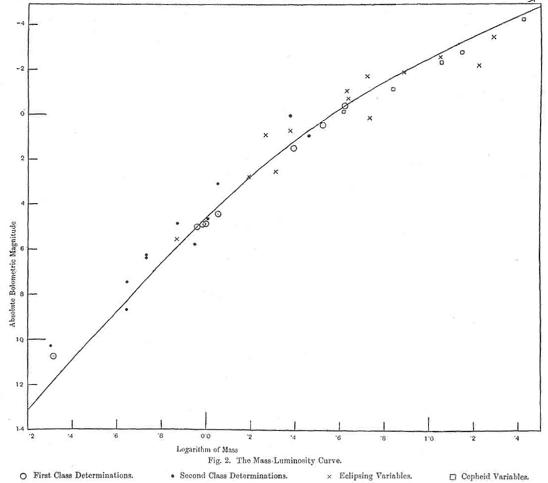
The mass-luminosity relation predicted by Eddington's stellar structure theory, compared to then-available data for various types of stars. The good agreement provided strong empirical evidence in support of Eddington's theory. [Reproduced from A.S. Eddington, The internal constitution of the stars, 1926 (1959 Dover reprint), Fig. 2]
In the late ninetenth century, it had been realized that for the kinds of internal temperature suggested by the early structural models of Lane and others, outward energy transport within the solar interior most likely took place via radiation, rather than convective currents. Capitalized on recent advances in the theory of radiative transfer, notably by Arthur Schuster (1851-1934) in England and Karl Schwarzschild (1873-1916) in Germany, Eddington set forth what remain to this days the basic theory of stellar structure. Because he focused on radiative equilibrium, Eddington's models gave their best results when compared to stars more massive than the sun, convection being indeed needed to properly described the outer 30% in radius of the sun. One vital missing piece still remained, namely the internal source of the Sun's energy...
References and further readings:
Tassoul, J.-L., and Tassoul, M., A concise history of solar and stellar physics, Princeton University Press, 2004.
1929: A Hydrogen Sun
In the mid-nineteenth century,
the matching of solar spectral lines with those produced by heated gases
in the laboratory had allowed Kirchhoff and others to infer
which chemical
elements are present in the Sun, but their relative abundances remained
a mystery for over half a century,
until the process of spectral line formation was understood quantitatively
through the rise of atomic physics and quantum mechanics. The first
essential step was provided in the early 1920's by Meghnad Saha (1894-1956),
who applied
statistical thermodynamic to Bohr's atom, to yield a theory allowing
the calculation of atomic ionisation states in terms of thermodynamic
variables (temperature, pressure, etc). This was soon generalized
by
E. Arthur Milne (1896-1950) and Ralph Howard Fowler (1889-1944) to
gases comprised of mixtures of different elements in varying ionisation states.
![]()
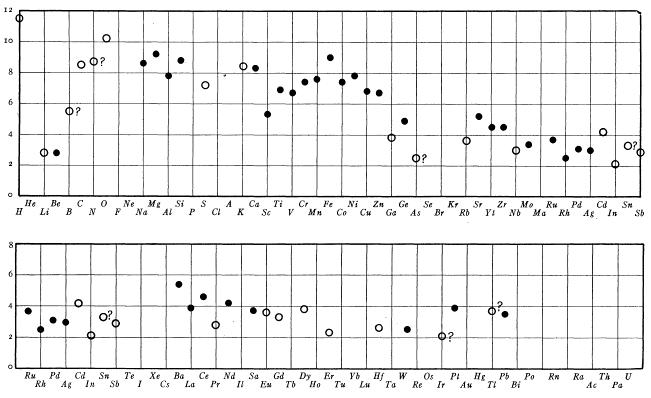
Compilation of mass fraction of various chemical elements present in the Sun, from a physical analysis of the solar spectrum by Henry Norris Russell. The vertical axis is the logarithmic of the surface mass density for each elemen t, and open symbols corresponds to elements for which Russell deemed the abundance determinations "less trustworthy". [Reproduced from Russel's 1929 paper cited below (Fig 3)].Application of the Saha-Fowler-Milne theory to the sun and stars was first carried out in 1925 by Cecilia H. Payne (1900-1979) as part of her PhD thesis. Working with a variety of stellar spectra, Payne found that Hydr ogen and Helium were by far the most abundant chemical elements in stars. This result ran counter to the widespread belief at the time that stars (and the Sun) had essentially the same chemical composition as the Earth. The preponderance of Hydrogen in the Sun was first established in 1928 by Albrecht Unsöld (1905-1995) on the basis of a few spectral lines. Full-force application of improved versions of physical spectroscopy to solar abundances determination was carried out in 1929 by Henry Norris Russell (1877-1957) who, despite his earlier strong belief to the contrary, could but conclude that Hydrogen is indeed the dominant constituent in the solar atmosphere, followed by Helium, and with m etals only present in comparatively very small quantity.
References and further readings:
Hufbauer, K. 1991, Exploring the Sun, The Johns Hopkins University Press, chap. 3
Tassoul, J.-L., and Tassoul, M., A concise history of solar and stellar physics, Princeton University Press, 2004: chap. 4.
Russell, H.N., On the composition of the sun's atmosphere, in The Astroph ysical Journal, 70, 11-82 (1929).
Much of the remarkable progress made in understanding the Sun's
outer atmosphere had been made through the use of observations
carried out at times of total solar eclipses. The relative rarity of such
eclipses, the cost and logistical difficulties of travelling to often
remote location to observe then, the short duration of totality,
as well as the frustrating vaguaries of weather,
motivated the search for a way to observe the corona at will and in full
daylight.
This was finally achieved in 1931 by the French solar physicist
Bernard Lyot (1897-1952), who first
designed an instrument now known as the coronagraph.
A coronagraph is nothing more than a telescope equipped
with an occulting disk sized in such a way as to block out the solar disk.
Although this may sound trivial, it turns out to be extremely difficult
to achieve the needed accurate optical alignment and mechanical
stability, without which stray light makes the viewing of the faint
corona all but impossible. Lyot also managed to secure the first
full daylight photographs of the corona. His success motivated other
to replicate and modify his design, the most succesful of these
followers being Max Waldmeier at the ETH/Zürich, and Donald H.
Menzel (1901-1976) at Harvard College Observatory.
Hufbauer, K. 1991, Exploring the Sun, The Johns Hopkins University
Press.
1931: The Coronagraph
![]()
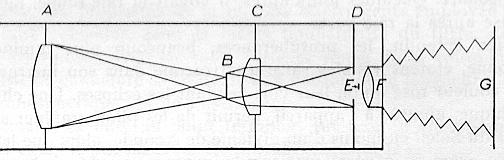
Lyot's first coronagraph design. The occulting disk is at B,
and the diaphragm and screen at D, E are needed to block stray light arising
from diffraction at the primary lens and diaphragm A.
Reproduced from L'Astronomie, 66 (1952)
(Fig. 113, p. 269).
References and further readings:
D'Azambuja, L. 1952,
L'oeuvre de Bernard Lyot, L'Astronomie, 66, 265-277.
1941: The million-degree solar corona
In the mid-1930's, coronagraphic observations of the solar corona by
Lyot
had revealed that the faint coronal emission lines were much broader
in wavelength than expected. Under the assumption that this broadening
was of a thermal nature, Lyot boldly inferred a coronal temperature
of around 600,000 K. However, since alternate broadening mechanisms
existed, his estimate of the high coronal temperature was met
with due caution at the time.
![]()
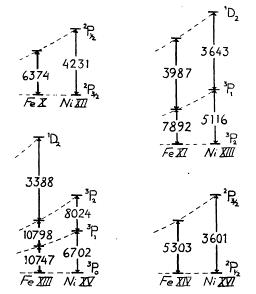 |
Schematic representations of the atomic energy levels and transitions responsible for the coronal emission lines. Young's 1869 green line is the 2P transition of FeXIV on the lower right. [Reproduced from: B. Edlen, Monthly Not. Roy. Astr. Soc., 105, 1945; Fig 4, p. 328 (George Darwin Lecture)] |
Acceptance of the very high coronal temperature ended up coming through the spectroscopic work of atomic physicists Walter Grotrian (1890-1954) and Bengt Edlén (1906-1993). The breakthrough came when it was realized that a large number of unidentified coronal emission lines, attributed starting in 1869 by Young and others to a hitherto unknown chemical element tentatively named "coronium", were in fact associated with high ionization stages of Iron (Fe) and Nickel (Ni). In fact, Edlén could show that 90% of all coronal emission lines could be attributable to FeX, FeXI, FeXIII and FeXIV. The required coronal temperatures, initially estimated greater than 250,000K, rapidly rose to the modern value of 1-2 million K.
References and further readings:
Shapley, H. (ed.), Source book in Astronomy, 1900-1950, Harvard University Press, 1960: paper 8.
1942: Solar radio emission
The possibility of radio emission (or "Hertzian waves" as it was known
at the times) by the Sun was contemplated as early as 1890 by the American
scientist Thomas A. Edison (1847-1931),
but the first actual attempts were carried out in England
by Sir Oliver Lodge (1851-1940).
As with subsequents attempts by others in the opening decades
of 20th century, no detection were made.
The difficulty was not just one of sensitivity, but also of
plain luck with timing of observations, since
the strongest radio emission occurs in very intermittent bursts
associated with large solar flares.
![]()
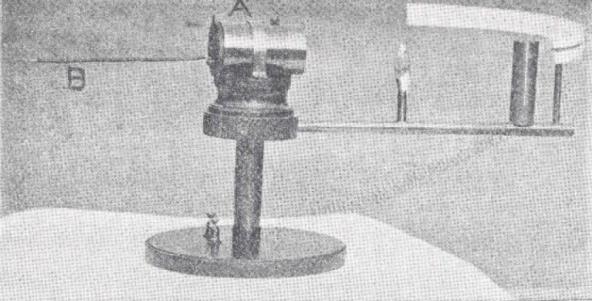
Lodge's experimental setup for detecting solar
radio waves. The cylinder "A" is filled with metal filings,
making a relatively poor conductor.
The large drop in resistance
caused by the absorption of a radio wave is readily
detectable via the enhanced electrical current flowing
through the circuit. The piece of wire
"B" acts as an antenna to increase absorption.
[reproduced from the collection of paper edited by W.T. Sullivan
cited below, Fig. 4 (p. 142)]
The conjunction of required conditions materialized serendipitously during
World War II, as a side effect of military radar development and research.
WWII radars were sensitive, operated nearly continuously, and did so at a
time spanning cycle 17's maximum phase, during which solar radio
bursts are more frequent. By the early 1940, numerous episodes of enhanced backg
round
noise and interference picked up by radar equipment had been noted.
Fearing that Germans were developing and testing radar jamming systems,
the British High Command instructed their radar experts to look into
the matter. In February 1942 James Hey detected
a burst of radio emission from the Sun, and a second one was
detected by
George C. Southworth (1890-1972) the following June. In America
an independent detection was carried out in November 1943
by the pioneer radioastronomer
Grote Reber (1911-2002).
Radar research being then a
militarily sensitive and highly classified subject, Hey and Southworth
could only publish their findings after the end of WWII,
and even then only in censored form.
Later solar radio observations were to confirm the million-degree temperature of the solar corona, inferred earlier by Grotrian and Edlén by spectroscopic means. Regular radio monitoring continued after World War II, with the so-called 10.7cm flux monitoring program at Canada's Herzberg Institute for Astrophysics, started in 1946, now providing the longest time series of a quantitative solar activity measurement other than counts of sunspots or faculae.
References and further readings:
Sullivan, W.T. III (ed.), Classics in Radio Astronomy, D. Reidel Publishing Co., 1982: part III-G through III-J.
The Solar Radio Monitoring Programme at the Herzberg Institute of Astrophysics.
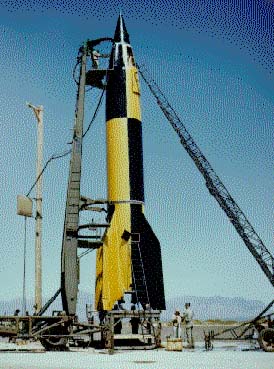 |
A German V2 rocket being prepared for launch at the White Sands Proving Groun ds (now known as White Sands Missile Range). in New Mexico. [Image dowloaded from WRMR Web site, see link below] |
At the 10 October 1946 launch, a team from the Naval Research Laboratory led by physicist Richard Tousey (1908-1997) managed to secure the first ever solar UV spectra down to 2100 Å. The spectrum was obtained via a photographic technique using a metal strip coated in fluorescent phosphorus as a recording medium. This marked the first astronomical observation ever carried out in space. At the 19 september 1949 V2 launch an another NRL team led by Herbert Friedman (1916-2000) used filters and photometers to carry our the first detection of the Lyman-alpha emission line at 1216 Å, as well as X-Ray emission at 8 Å. Bona fide spectra going down to the Lyman-alpha region of the solar electromagnetic spectrum were only obtained in 1952, following improvements in pointing technology for rocket-borne instruments.
References and further readings:
Hufbauer, K. 1991, Exploring the Sun, The Johns Hopkins University Press.
Boas, M. 1962, The Scientific Renaissance 1450-1630, Harper & Row
[Dover reprint available].
Crowe, M.J. 1990, Theories of the World from Antiquity to the
Copernican Revolution, Dover.
Hall, A.R. 1963, From Galileo to Newton 1630-1720, Harper & Row
[1981 Dover reprint].
Hoskin, M. 1997 (ed.), The Cambridge illustrated History
of Astronomy, Cambridge: Cambridge University Press.
Hufbauer, K. 1991, Exploring the Sun,
The Johns Hopkins University Press.
Meadows, A.J. 1970, Early Solar Physics, Pergamon Press.
Moore, P. 1974, Watchers of the Stars, Putnam.
Pannekoek, A. 1961, A History of Astronomy,
New York: John Wiley Interscience.
Tassoul, J.-L., and Tassoul, M. 2004, A concise history of solar
and stellar physics, Princeton University Press.
Galileo, G. 1610, Sidereus Nuncius, trans.
A. van Helden 1989, The University of Chicago Press.
Galileo, G. 1632, Dialogues concerning the two chief world systems,
trans. S. Drake, 2nd edition 1967, University of California Press.
Lang, K.R. 2006, Sun, Earth and Sky, Springer.
Lang, K.R. 2001, Cambridge Encyclopedia of the Sun,
Cambridge University Press
Foukal, P.V. 1990, Solar Astrophysics, John Wiley and Sons.
Lang, K.R. 2000, The Sun from Space, Springer.
Stix, M. 1989, The Sun, Springer.
Further Readings:
Historical, general:
Historical, source material:
Solar Physics, Non-Technical:
Solar Physics, Textbooks and Technical:
A selection of Historical Web Ressources:
The Galileo Project at Rice University
If so, we really want to know! please e-mail
paulchar@astro.umontreal.ca
 To search for a Solar
Physicist
To search for a Solar
Physicist
 To references and
further reading
To references and
further reading
 To the GRPS homepage
last modification on january 18 2008 by
paulchar@astro.umontreal.ca
Tous droits réservés / Copyrighted
by
Université de Montréal