Avalanche Models of Magnetospheric Substorms

The most intense geomagnetic storms are almost always triggered by
the impact of solar ejecta on the dayside magnetosphere. However,
there also exist a class of geoeffective phenomena, known as
substorms, that do not appear correlated with the arrival of
strong disturbances in the solar wind. Substorms are intermittent
events manifesting themselves
most spectacularly (but not exclusively) through auroral emission
(see Figure 1), and usually originate from the nightside magnetosphere.
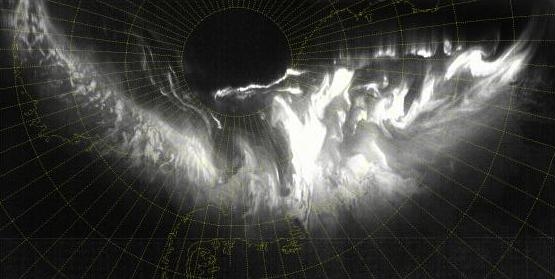
Figure 1:
Auroral emission associated with the development of a
magnetospheric substorm near the South Pole, on 21 July 1993.
The geographic (as opposed to geomagnetic)
latitude-longitude grid is also indicated. DMSP satellite image
from the
U.S. National Geophysical Data Center
The simplest physical view of the substorm phenomenon is that
of a sudden unloading of energy having accumulated slowly in the magnetosphere
due to the pressure exerted by the solar wind. That this unloading
occurs so intermittently despite gradual energy loading is suggestive
of a metastable state subjected to a dissipative instability with
a finite threshold for onset. Estimates of energy released by
substorms based on auroral emission have revealed a power-law
form for the frequency distribution of substorm energy, which
has led some authors to suggest that substorms are a manifestation
of self-organized criticality (SOC), associated with avalanches
of magnetic reconnection events in the magnetotail.
We have developed a model that places the "action" not
in the magnetotail per se, but in the equatorial plasma sheet
located closer to earth, and where in situ measurements
actually locate the onset of substorms (Figure 2). The idea
is that magnetic flux tubes crossing the plasma sheet (region
labeled "Nightime Substorm Region" on Fig. 2)
are slowly stretched
by the solar wind until they become unstable with respect
to one or more plasma instability, leading to energy
redistribution to neighbouring flux tubes, which can push
those beyond the instability threshold, leading to more
energy being redistributed to flux tubes farther away, and so
in classical avalanching style. The numerical simulation is
run as a cellular automaton using local redistribution rules.
Figure 2:
Schematic view of the Earth's magnetosphere, and of various
events that can follwo the impact of solar ejecta on the
dayside of the magnetosphere. The blue surface represent
the quasi-steady magnetic flux surfaces that result from
the quasi-steady interaction of the solar wind with the
Earth's own magnetic field. Animated gif produced by NASA's
Magnetospheric Multiscale Mission
Team.
Using a one-dimensional version of the model described above,
namely a line-segment oriented from the Earth to the magnetotail,
we could already demonstrate that such an avalanching system,
driven by steady, deterministic loading, could produce
avalanches with a power-law distribution of sizes
(see Figure 3). Interestingly, the so-called falloff
energy, namely energy evacuated at the earthside boundary
of the 1D lattice, shows well-peaked distributions of
both energy and inter-event waiting times, resembling
the so-called quadiperiodic sawtooth events observed
as "injection events"
in measurements of the magnetospheric ring current,
another manifestation of substorms.
Figure 3:
Time series of energy released by lattice avalanches (red) and
Earthside falloff avalanches (green). The former are characterized
by a power law in their size frequency distribution, while the
latter are quasiperiodic and have a relatively well-peaked
distribution of energy release. The top panel shows the spatiotemporal
evolution of avalanches, with the time axis coincident with
that of the time series. Note the vast range of sizes in internal
avalanches (red arrows), and the internal avalanche triggering
an Earthside injection event (in green).
Adapted from the GRL paper by Liu et al. cited below.
These very encouraging results obtained with the "proof-of-concept"
1D model are now being examined in a 2D version of the model.
The computational plane represents a central plasma sheet
of zero thickness.
The animation below (Figure 4) shows a short segment of a 2D
simulation, including a large earthside falloff avalanche.
We are pursuing development of this model, with the aim of
carrying out detailed comparison between spatial properties
of avalanches (propagation patterns, fractal indices)
with corresponding properties inferred from auroral observations.
Figure 4:
A 2D simulation of avalanches in the equatorial plane of the
central plasma sheet.
Earth is towards the left, and the magnetotail to the right.
The contours correspond to energy density in the plasma sheet,
and the color scale codes the energy released locally by each
node during an avalanche.
Click on the image to view
a short animation including a large avalanche with Earthside
discharge (mpeg, 38MB).
Who in the group works on this:
Laura Morales,
Paul Charbonneau,
Michel-André Valličre-Nollet,
Amélie Bouchat.
This is a joint research effort with scientists at the Canadian
Space Agency, primarily William Liu and Jun Liang.
Recent publications by group members on this topic:
- Liu, W., Charbonneau, P., Donovan, E., & Manuel, J.,
An avalanche model of magnetospheric substorms based on cross-scale
coupling in the central plasma sheet,
Eight International Conference on Substorms, Banff, 27--31 Mars 2006.
Click here for a preprint (pdf, 72KB).
- Liu, W., Charbonneau, P., Thibault, K., and Morales, L. 2006,
Geophysical Research Letters, 33, L19106.