
1859: First observation of a solar flare
On 1 September 1859, the amateur astronomer
Richard C. Carrington
(1826-1875) was engaged in his daily monitoring of sunspots, when he
noticed two rapidly brightening patches of light near the middle
of a sunspot group he was studying (indicated by A and B on the drawing
below).
In the following minutes the patches dimmed again while moving with
respect to the active region, finally disappearing at positions C and D.
This unusual event was also independently
observed by R. Hodgson (1804-1872), another British astronomer.
Reproduction of a drawing by R.C. Carrington, showing the location of the flare he observed while making a drawing of an active region. Reproduced from his 1860 paper in Monthly Notices of the Royal Astronomical Society (vol. 20, p. 13).
Both Carrington and Hodgson noted that magnetic monitoring instruments registered strong disturbances at about the same time, but it is not possible to tell for sure whether these were due to the flare they actually saw. It is more likely that they were caused by other generalized solar disturbances of which the flare was but one manifestation.
Carrington, R.C. 1860, Monthly Notices of the Royal Astronomical Society, 20, p. 13. Lang, K.R. 2000, The Sun from Space, Springer, chap. 6
1859: The chemical composition of the Sun
In the late 1850s the chemist
Robert Wilhelm Bunsen (1811-1899) and theoretical physicist
Gustav Kirchhoff
(1824-1887), both at Heidelberg,
took on the issue of spectral line identification
pretty much where
Fraunhofer
had left it some 40 years earlier.
By simultaneous observations of the solar spectrum and laboratory
flame spectra, they showed that (bright) emission lines in heated gases
coincide with (dark) absorption lines seen when observing white
light shining through the same cool gas. This established the empirical
basis needed for the
identification of the dark lines seen in the solar spectrum. By careful
comparison with emission lines seen in the laboratory for various
pure gases, Kirchhoff could demonstrate the existence in the Sun of a large
number of chemical elements, mostly metals, also present on Earth.
Hydrogen was identified spectroscopically
in 1862 by A. Ångström (1814-1874), but it is only much later,
in the 1920's,
that Hydrogen was recognized as the most abundant solar constituent.
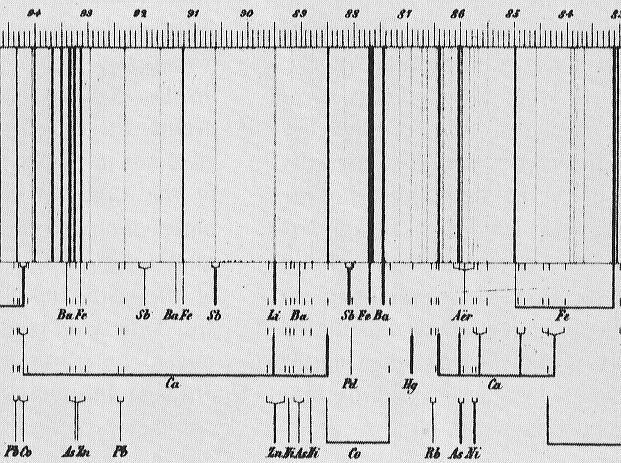
Reproduction of part of the map of the solar spectrum published in 1863 by Kirchhoff, showing the identification of a large number of spectral lines with various chemical elements. Note numerous clear matches for Iron (Fe).
Following this and other groundbreaking work by David Brewster (1781-1868) and Ångström, spectroscopy continued to progress throughout the second half of the eighteenth century. In the solar context, some of the most active and innovative observers were J. Norman Lockyer (1836-1920) Jules Janssen (1824-1907), Hermann Carl Vogel (1841-1907), William Huggins (1824-1910), Angelo Secchi (1818-1878), Charles Young (1834-1908), and Samuel Langley (1834-1906). Even at that time, spectroscopy was still an empirical science without a sound physical basis, as quantum mechanics lay half a century in the future.
Meadows, A.J. 1984, The Origins of Astrophysics, in The General History of Astronomy, vol. 4A, ed. O. Gingerich, Cambridge University Press, pps. 3-15.
Today coronal mass ejections
are known to represent one of the more energetic
-and geoeffective- manifestation of solar activity, with up
to 10 billion tons of material being ejected into interplanetary
space at speeds reaching up to 1000 kilometer per second. For more
detail on CMEs see
slide 13 and
slide 14
of the HAO slide set).
1860: First observations of a coronal mass ejection
The total solar eclipse of 18 July 1860 was probably the most thoroughly
observed eclipse up to that time. The three drawings are a sample
of drawings produced at that time which include depictions
of a peculiar feature in the SW (lower right) portion of the corona.
Based on comparison with modern coronal observations,
it is quite likely that these represent the first record of a
Coronal Mass Ejection in progress.


Click on the above to view full size diagrams
Drawings of the 1860 eclipse by G. Tempel (top left),
von Feilitzsch (top center),
F.A. Oom (top right), E.W. Murray (bottom right), F. Galton (bottom center),
and C. von Wallenberg (bottom right).
Reproduced from Ranyard, C.A 1879, Mem. Roy. Astron. Soc., 41,
520, chap. 44.
References and further readings:
Eddy, J.A. 1974, A Nineteenth-century Coronal Transient, in
Astronomy and Astrophysics, 34, 235-240.
1865: The first solar cycle model
For nearly two decades the sunspot cycle uncovered by
Schwabe begged for an explanation.
In the quest for a physical explanation, its
Its apparent cyclicity lead naturally to a well-known piece
of celestial clockwork: planetary motions.
Already in 1852,
Rudolf Wolf took due note of the approximate
numerical coincidence between the sunspot cycle period of 11.1 years
with the orbital period of Jupiter (11.86 yr), and later proceeded to
fit his time series of
relative sunspot number
to a quadruple-harmonic function based on the orbital periods
of Jupiter, Saturn, Earth and Venus. However, Wolf himself
was not overly impressed with his fits, and he wisely refrained from
drawing strong conclusions from his results. However, others would soon
discover what looked for a while like a very appealing variation on this theme,
based on planetary tidal influences.
 |
The method used by the Kew team to link the variations of sunspot areas with planetary positions. The diagram is drawn in the solar equatorial plane. The portion of the solar disk facing Earth (bottom) is divided into 10 contiguous longitudinal sectors each 14 deg wide. As solar rotation carries sunspots across the sectors, the total sunspot areas in each sector are computed and grouped according to this or that planet being in the quadrant centered on conjunction (A), opposition (C) and quadrature (B and D). [Reproduced from: P. Charbonneau, Journal for the history of astronomy, 33, Fig. 4] |
The first detailed, quantitative physical model of the solar cycle was developped between 1865 and 1872 by an odd trio of solar observers working at Kew Observatory in England: the terrestrial magnetism expert and observatory's director Balfour Stewart (1828-1887); The head of the solar photographic program and oftentimes financial backer Warren De La Rue (1815-1889); and the human computer Benjamin Loewy, a young astronomer trained in Hamburg and hired specifically for data reduction work on the various solar projects ongoing at Kew. Following up on an earlier idea by Stewart, they looked for correlations between planetary ecliptical longitudes and the appearance, growth and decay of individual spots located at specific heliographic longitudes. While they originally found a number of promising correlations involving Venus, Jupiter and Mercury, these all fail to hold as more extended data became available. By 1874 they had largely abandoned the idea, although for half century theirs remained the only extant physical model of the solar cycle, and as such was often discussed in solar physics textbooks into the first decades of the twentieth century.
Charbonneau, P., The rise and fall of the first solar cycle model, in Journal for the history of astronomy, 33, 351-372, 2002.
De La Rue, W., Stewart, B., and Loewy, B., Researches on solar physics. Second series. On the behavoir of the sun-spots with regard to increase and diminution, Proceedings of the Royal Society of London, 14, 59-63, 1865.
1869: The coronal green line
At the 7 August 1969 solar eclipse, visible in North America,
the american astronomers
Charles A. Young (1834-1908)
and William Harkness (1837-1903)
both independently noted the presence of a faint
emission line in the green part of the otherwise
featureless coronal spectrum.

Late nineteenth century Map of the coronal spectrum in the vicinity of the so-called "green line" ascribed to the mysterious chemical element "coronium". The numerical scale on top corresponds to the modern scale introduced by Angstrom, while the "1474" label refers to a scale introduced earlier by Kirchhoff. These are all emission lines superimposed on a fainter continuum. [Reproduced from: A.C. Young, The Sun, second edition 1896, Fig. 93 (p. 258)]
Young, one of the leading spectroscopists of his times, would have never imagined that this discovery would offer solar astronomers a puzzle that would survive him by over three decades. Young himself put a lot effort in identifying the mysterious "coronal green line", first tentastively identifying it with a laboratory iron line, then in 1876 resolving iit into a doublet of which one component did not coincide with anything known in the laboratory. Young and others thus suggested the possible existence of a new chemical element unknown on Earth, which they named coronium.
Meadows, A.J. 1970, Early Solar Physics, Pergamon Press.
More on Coronium, from laserstars.org
Knowing the Sun's mass and radius, Lane could integrate the
density profile to set the density scale, leading to a surface density
of 0.000363 gram per cubic centimeters.
Then, using then the perfect gas
law, he could estimate the sun's atmospheric temperature,
arriving at at 30,000K. Though some five times too high by modern
standards, this confirmed the high temperatures inferred
by spectroscopic means.
Tassoul, J.-L., and Tassoul, M., A concise history of solar
and stellar physics, Princeton University
Press reprint, 2004.
1870: The internal structure of the sun
Throughout the eighteenth and nineteenth century, ideas regarding
the internal constitution of the sun and stars ranged high
and wide. By the 1860's, the spectroscopic work of Kirchoff
and collaborators had offered strong evidence that
at least the solar atmosphere was in gaseous form, and quite
hot at that, but ideas regarding the solar interior remained
in the realm of pure speculation. This first began to change
with the groundbreaking work Jonathan H. Lane (1819-1880),
who in 1870 published a paper in the
American Journal of Science and Arts
(vol. 50, p. 57) presenting a first mathematical
model of the solar interior. Lane assumed that the sun's interior
was gaseous and chemically homogeneous
throughout, and in a state of hydrostatic equilibrium,
whereby the inward gravitational pull of the sun's mass is everywhere balanced
by an outward gradient in gas pressure. Further assuming that
thermal equilibrium enforced by convective motions would
lead to an adiabatic stratification,
Lane obtained mathematical relationships
describing the rise of density
and temperature as one moves from the surface towards the sun's
center.
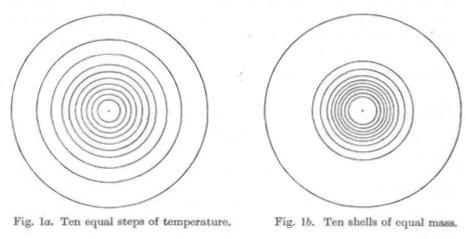
Diagrams illustrating
the internal structure of Lane's polytropic spheres. The two sets
of concentrics spherical shells drawn here correspond
to ten equally spaced isolevels of temperature (left)
and fractional mass
(right), and illustrate graphically the internal
stratification of stars in simultaneous hydrostatic and
convective equilibrium.
[Reproduced from
A.S. Eddington, The internal constitution of the stars, 1926
(1959 Dover reprint), Fig. 1]
References and further readings:
1881: The solar constant, again
By the second half of the nineteenth century, after various
solar observing expedition to mountaintops,
it was becoming
increasingly clear that the Earth's atmosphere absorbs a significant
portion of the sun's luminosity. Consequently, attempts at determining
the solar constant were moved to the highest practical altitudes.
 |
Langley's base camp on California's Mt Whitney, July 1881. Some of Langley's instruments failed to arrive or arrived damaged, with the crucial spectral bolometer back in working order only by the end of August. The expedition was cut short on 8 September due to worsening observing conditions caused by the breakout of a series of wildfires elsewhere in California a few days earlier. Nonetheless, valuable data were collected. Reproduced from: Eddy, J.A. 1990, J. Hist. Astron., 21, p. 115. |
The American scientist Samuel Langley (1834-1906) carried out the most elaborate attempt at determining the solar constant at the time, during an expedition to Mt Whitney, California, in July 1881. Using his recently invented bolometer (an instrument based on the varying electrical resistivity of metals with temperature), as well as other instruments, Langley carried out measurements at different wavelengths and at different altitudes, demonstrating the strong variation with wavelength of the absorption by Earth's atmosphere. However, the solar constant value he calculated at the time, 2903 Watt per square meters, is nearly a factor of two larger than the modern value (1367 W/m2), something apparently due to errors in the data reduction procedure, since Langley's later assistant Charles Abbot (1872-1973) obtained 1465 W/m2 with the original Mt Whitney data.
Hufbauer, K. 1991, Exploring the Sun, The Johns Hopkins University Press.Eddy, J.A. 1990, Journal for the History of Astronomy, 21, p. 115.
Foukal, P.V. 1990, Solar Astrophysics, John Wiley and Sons.
1899: The Sun and the Aurora Borealis
The idea of solar-terrestrial interactions, going back to
William Herschel's
suggestion of a correlation
between sunspots and climate, was buttressed somewhat by the
1852 discovery of the
link between geomagnetic activity and the sunspot cycle,
but throughout the nineteenth the overall idea was
considered suspicious by the scientific establishment. The modern era
of solar-terrestrial interaction studies was launched by the
pioneer norwegian scientist
Kristian Birkeland (1867-1917) who, in the course of the 1899-1900
Norwegian Polar Expedition,
set out to study in detail the Aurorae Borealis. Birkeland
concluded from his various observations that aurorae are
caused by the episodic
arrival of beams of charged particles from the Sun, deflected and guided
to high geographic latitudes by the Earth's magnetic field.


The photograph on the left shows Birkeland's so-called terella experiment (with Birkeland himself operating the apparatus). Beams of electrons are shot at a spherical magnet to produce light emission concentrated in auroral-like arcs (photograph on right). [Images downloaded from Birkeland current document on www.answers.com]
In the first decade of the twentieth century Birkeland went on to produce artificial aurorae in his laboratory, by sending cathode rays (beams of electrons) on a spherical magnet, as depicted on the above photographs. By modern standards, Birkeland explanation of the origin of aurora borealis is correct in the main although not in all details. Unfortunately, Birkeland's groundbreaking contribution to auroral physics were dismissed by most other researchers at the time as overly speculative or even irrelevant, and only gained proper appreciation in the second half of the twentieth century.
Project NORDLYS - Northern Lights - Birkeland
Jago, L., The Northern Lights, Penguin Press, 2002
1904: The butterfly diagram
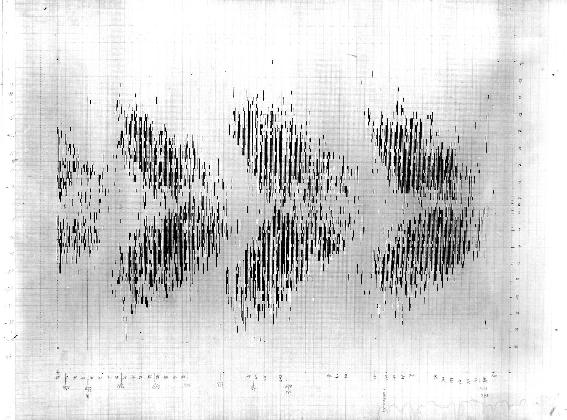
Photograph of the first sunspot butterfly diagram, drawn in
1904 by Walter and Annie Maunder. Over each successive solar rotation,
a vertical line segment spanning the range of latitudes where sunspots are obse
rved
is drawn on a time-latitude diagram.
This results in a striking visual depiction of the wave-like
spatiotemporal progression of magnetic activity in the course of the
solar cycle.
[Source: T.J. Bogdan/High Altitude Observatory]
While the equatorward drift of sunspot emergences as the cycle proceeds had
been noted already in the mid-nineteenth century by
Spörer and
Carrington, it was put on his most
graphicaly striking form by the husband-and-wife team
of
E. Walter Maunder (1851-1928)
and
Annie Maunder (1868-1947).
It occurred to them to plot, on a time-latitude diagram, the latitude
at which sunspots are observed, independently of their heliographic longitude,
over a time span covering a complete solar cycle. This graphical
depiction remains in use today, although what is commonly
plotted is the fractional area coverage of sunspots as a function
of latitude (see for example
this butterfly diagram, produced by D. Hathaway
at NASA's Marshall Space Flight Center).
The sequential "butterflies"
defined by successive cycles are tracking the
equatorward progression of a cyclic "magnetic wave" produced
deep within the solar interior by a hydromagnetic dynamo mechanism.
Century-old sunspot chart is restored, UCAR Quarterly Communication, summer 2000.
1906: The structure of the solar atmosphere
Since Kirchhoff, it was generally believed that the solar
atmosphere was made of a layer of cool gas, illuminated
from below by the hotter, luminous solar interior. Such
an inert atmosphere would appear darker near the solar limbs
than at disk center, since in the former situation a greater
thickness of atmosphere is traversed along the line-of-sight.
This limb darkening had indeed been observed since Galileo's time,
but the accurate quantitative measurements made in the second
half of the nineteenth century, in particular by
Langley, yielded results incompatible
with a simple inert, absorbing atmosphere.
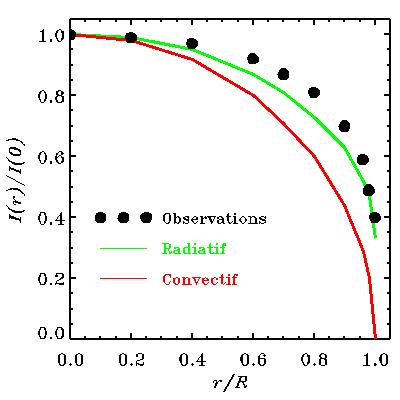 |
Modern plot of the numerical results tabulated in the landmark 1906 paper by Schwarzschild cited below. The plots shows the expected center-to-limb darkening, the green line corresponding to an atmosphere in radiative equalibrium, and the red line to the adiabatic stratification expected from convective equilibrium. The solid dots are the measured values. Disk center is at r/R=0 and the limb at r/R=1. |
Progress first took place at the hand of the german-born british physicist Arthur Schuster (1851-1934), who in a series of papers written between 1903 and 1905 investigated the passage of radiation through an atmosphere that can not only absorp, but also emit and scatter and re-emit the light traversing it. A full model of the solar atmosphere based on radiative equilibrium was soon put calculated by the german astrophysicist Karl Schwarzschild (1873-1916), who could also show that the observed limb solar darkening profile pointed to a state of radiative equilibrium, rather than the adiabatic stratification expected to result from convective equilibrium. Schwarzschild's remarkable 1906 paper opened the door to the physical interpretation of stellar spectra, and more generally to the construction of realistic structural and evolutionary models of the sun and stars.
Meadows, A.J. 1970, Early Solar Physics, Pergamon Press.
Tassoul, J.-L., and Tassoul, M., A concise history of solar and stellar physics, Princeton University Press, 2004.
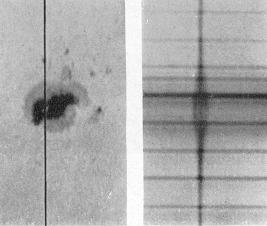 |
The magnetically-induced Zeeman splitting in the spectrum of a sunspot. Reproduced from the 1919 paper by G.E. Hale, F. Ellerman, S.B. Nicholson, and A.H. Joy (in The Astrophysical Journal, vol. 49, pps. 153-178). |
The study of sunspots and their 11-year cycle was finally put on a firm physical footing by the epoch-making work of George Ellery Hale (1868-1938) and collaborators, in the opening decades of the twentieth century. In 1907-1908, by measuring the Zeeman splitting in magnetically sensitive lines in the spectra of sunspots and detecting the polarization of the split spectral components, Hale provided the first unambiguous and quantitative demonstration that sunspots are the seats of strong magnetic fields (see also slide 4 and slide 5 of the HAO slide set The Sun: a Pictorial Introduction). Not only was this the first detection of a magnetic field outside the Earth, but the inferred magnetic field strength, 3000 Gauss, turned out over a thousand times greater than the Earth's own magnetic field. It was subsequently realized that the pressure provided by such strong magnetic field would also lead naturally to the lower temperatures observed within the sunspots, as compared to the photosphere.
Hale, G.E. 1908, On the probable existence of a magnetic field in sunspots, The Astrophysical Journal, 28, pps. 315-343,
Stix, M. 1989, The Sun, Springer.
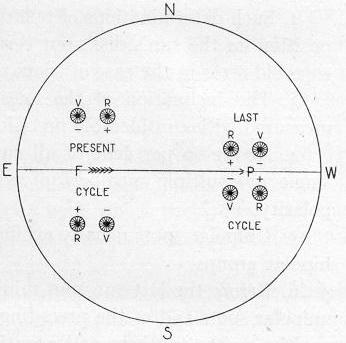 |
A diagram taken from the 1919 paper by G.E. Hale, F. Ellerman, S.B. Nicholson, and A.H. Joy (in The Astrophysical Journal, vol. 49, pps. 153-178), illustrating what is now known as Hale's polarity laws.. This presented solid evidence for the existence of a well-organized large-scale magnetic field in the solar interior, which cyclically changes polarity approximately every 11 years. |
In the decade following his groundbreaking discovery of sunspot magnetic fields, George Ellery Hale (1868-1938) and his collaborators went on to show that large sunspots pairs almost always (1) show the same magnetic polarity pattern in each solar hemisphere, (2) show opposite polarity patterns between the North and South solar hemispheres, and (3) these polarity patterns are reversed from one sunspot cycle to the next, indicating that the physical magnetic cycle has a period of twice the sunspot cycle period. These empirical observations have stood the test of time and are since known as Hale's polarity Laws. Their physical origin is now now known to originate with the operation of a large scale hydromagnetic dynamo within the solar interior, although the details of the process are far from adequately understood. Because the sun's dynamo generated magnetic field is ultimately responsible for all manifestations of solar activity (flares, coronal mass ejections, etc.), to this day solar dynamo modeling remains a very active area of research in solar physics.
Hale, G.E., Ellerman, F., Nicholson, S.B., and Joy, A.H. 1919, The Astrophysical Journal, 49, pps. 153-178,
Stix, M. 1989, The Sun, Springer.
1926: The internal structure of the sun, again
The theory of
solar internal structure originally
developped by Lane
in 1870, and later elaborated upon by many researchers
including most notably August Ritter (1826-1908)
and Robert Emden (1862-1940), reached its mature form in the
all-encompassing theory of stellar structure
developped by
Arthur Stantley Eddington (1882-1944) over a ten year period starting
in 1916, and culminating with the publication in 1926 of his
book The Internal Constitution of the Stars.
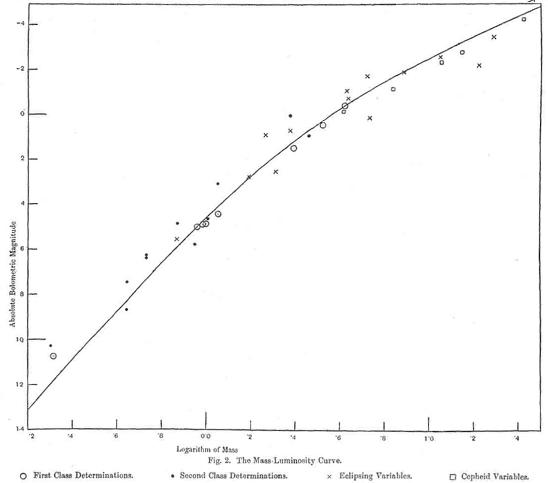
The mass-luminosity relation predicted by Eddington's stellar structure theory, compared to then-available data for various types of stars. The good agreement provided strong empirical evidence in support of Eddington's theory. [Reproduced from A.S. Eddington, The internal constitution of the stars, 1926 (1959 Dover reprint), Fig. 2]
In the late ninetenth century, it had been realized that for the kinds of internal temperature suggested by the early structural models of Lane and others, outward energy transport within the solar interior most likely took place via radiation, rather than convective currents. Capitalized on recent advances in the theory of radiative transfer, notably by Arthur Schuster (1851-1934) in England and Karl Schwarzschild (1873-1916) in Germany, Eddington set forth what remain to this days the basic theory of stellar structure. Because he focused on radiative equilibrium, Eddington's models gave their best results when compared to stars more massive than the sun, convection being indeed needed to properly described the solar outer layers. One vital missing piece still remained, namely the internal source of the Sun's energy...
Tassoul, J.-L., and Tassoul, M., A concise history of solar and stellar physics, Princeton University Press, 2004.
Much of the remarkable progress made in understanding the Sun's
outer atmosphere had been made through the use of observations
carried out at times of total solar eclipses. The relative rarity of such
eclipses, the cost and logistical difficulties of travelling to often
remote location to observe then, the short duration of totality,
as well as the frustrating vaguaries of weather,
motivated the search for a way to observe the corona at will and in full
daylight.
This was finally achieved in 1931 by the French solar physicist
Bernard Lyot (1897-1952), who first
designed an instrument now known as the coronagraph.
A coronagraph is nothing more than a telescope equipped
with an occulting disk sized in such a way as to block out the solar disk.
Although this may sound trivial, it turns out to be extremely difficult
to achieve the needed accurate optical alignment and mechanical
stability, without which stray light makes the viewing of the faint
corona all but impossible. Lyot also managed to secure the first
full daylight photographs of the corona. His success motivated other
to replicate and modify his design, the most succesful of these
followers being Max Waldmeier at the ETH/Zürich, and Donald H.
Menzel (1901-1976) at Harvard College Observatory.
Hufbauer, K. 1991, Exploring the Sun, The Johns Hopkins University
Press.
1931: The Coronagraph

Lyot's first coronagraph design. The occulting disk is at B,
and the diaphragm and screen at D, E are needed to block stray light arising
from diffraction at the primary lens and diaphragm A.
Reproduced from L'Astronomie, 66 (1952)
(Fig. 113, p. 269).
References and further readings:
D'Azambuja, L. 1952,
L'oeuvre de Bernard Lyot, L'Astronomie, 66, 265-277.
1941: The million-degree solar corona
In the mid-1930's, coronagraphic observations of the solar corona by
Lyot
had revealed that the faint coronal emission lines were much broader
in wavelength than expected. Under the assumption that this broadening
was of a thermal nature, Lyot boldly inferred a coronal temperature
of around 600,000 K. However, since alternate broadening mechanisms
existed, his estimate of the high coronal temperature was met
with due caution at the time.
 |
Schematic representations of the atomic energy levels and transitions responsible for the coronal emission lines. Young's 1869 green line is the 2P transition of FeXIV on the lower right. [Reproduced from: B. Edlen, Monthly Not. Roy. Astr. Soc., 105, 1945; Fig 4, p. 328 (George Darwin Lecture)] |
Acceptance of the very high coronal temperature ended up coming through the spectroscopic work of atomic physicists Walter Grotrian (1890-1954) and Bengt Edlén (1906-1993). The breakthrough came when it was realized that a large number of unidentified coronal emission lines, attributed starting in 1869 by Young and others to a hitherto unknown chemical element tentatively named "coronium", were in fact associated with high ionization stages of Iron (Fe) and Nickel (Ni). In fact, Edlén could show that 90% of all coronal emission lines could be attributable to FeX, FeXI, FeXIII and FeXIV. The required coronal temperatures, initially estimated greater than 250,000K, rapidly rose to the modern value of 1-2 million K.
Shapley, H. (ed.), Source book in Astronomy, 1900-1950, Harvard University Press, 1960: paper 8.
Later solar radio observations were to confirm the
million-degree temperature of the solar corona,
inferred earlier by Grotrian and Edlén by spectroscopic
means. Regular radio monitoring continued after World War II, with the so-called
10.7cm flux monitoring program
at Canada's Herzberg Institute for Astrophysics,
started in 1946, now providing the longest
time series of a quantitative solar activity measurement other than
counts of sunspots or faculae.
Sullivan, W.T. III (ed.), Classics in Radio Astronomy, D. Reidel
Publishing Co., 1982:
part III-G through III-J.
The Solar Radio Monitoring Programme at the Herzberg Institute
of Astrophysics.
Boas, M. 1962, The Scientific Renaissance 1450-1630, Harper & Row
[Dover reprint available].
Crowe, M.J. 1990, Theories of the World from Antiquity to the
Copernican Revolution, Dover.
Hall, A.R. 1963, From Galileo to Newton 1630-1720, Harper & Row
[1981 Dover reprint].
Hoskin, M. 1997 (ed.), The Cambridge illustrated History
of Astronomy, Cambridge: Cambridge University Press.
Hufbauer, K. 1991, Exploring the Sun,
The Johns Hopkins University Press.
Meadows, A.J. 1970, Early Solar Physics, Pergamon Press.
Moore, P. 1974, Watchers of the Stars, Putnam.
Pannekoek, A. 1961, A History of Astronomy,
New York: John Wiley Interscience.
Foukal, P.V. 1990, Solar Astrophysics, John Wiley and Sons.
Lang, K.R. 2000, The Sun from Space, Springer.
Stix, M. 1989, The Sun, Springer.
Return to Earlier Great Moments
in the history of solar physics.
-Written by paulchar@astro.umontreal.ca.
-Last revised 8 January 2008 by
paulchar@astro.umontreal.ca
1942: Solar radio emission
The possibility of radio emission (or "Hertzian waves" as it was known
at the times) by the Sun was contemplated as early as 1890 by the American
scientist Thomas A. Edison (1847-1931),
but the first actual attempts were carried out in England
by Sir Oliver Lodge (1851-1940).
As with subsequents attempts by others in the opening decades
of 20th century, no detection were made.
The difficulty was not just one of sensitivity, but also of
plain luck with timing of observations, since
the strongest radio emission occurs in very intermittent bursts
associated with large solar flares.

Lodge's experimental setup for detecting solar
radio waves. The cylinder "A" is filled with metal filings,
making a relatively poor conductor.
The large drop in resistance
caused by the absorption of a radio wave is readily
detectable via the enhanced electrical current flowing
through the circuit. The piece of wire
"B" acts as an antenna to increase absorption.
[reproduced from the collection of paper edited by W.T. Sullivan
cited below, Fig. 4 (p. 142)]
The conjunction of required conditions materialized serendipitously during
World War II, as a side effect of military radar development and research.
WWII radars were sensitive, operated nearly continuously, and did so at a
time spanning cycle's 17 maximum phase, during which solar radio
bursts are more frequent. By the early 1940, numerous episodes of enhanced backg
round
noise and interference picked up by radar equipment had been noted.
Fearing that Germans were developing and testing radar jamming systems,
the British High Command instructed their radar experts to look into
the matter. In February 1942 James Hey detected
a burst of radio emission from the Sun, and a second one was
detected by
George C. Southworth (1890-1972) the following June. In America
an independent detection was carried out in November 1943
by the pioneer radioastronomer Grote Reber (1911-2002).
Radar research being then a
militarily sensitive and highly classified subject, Hey and Southworth
could only publish their findings after the end of WWII,
and even then only in censored form.
References and further readings:
Further General Readings
Historical:
Solar Physics, Non-Technical:
Cambridge Encyclopedia of the Sun
Solar Physics, Textbooks and Technical:
Other web sites:
The Galileo Project
Institute and Museum of History of Science, Florence